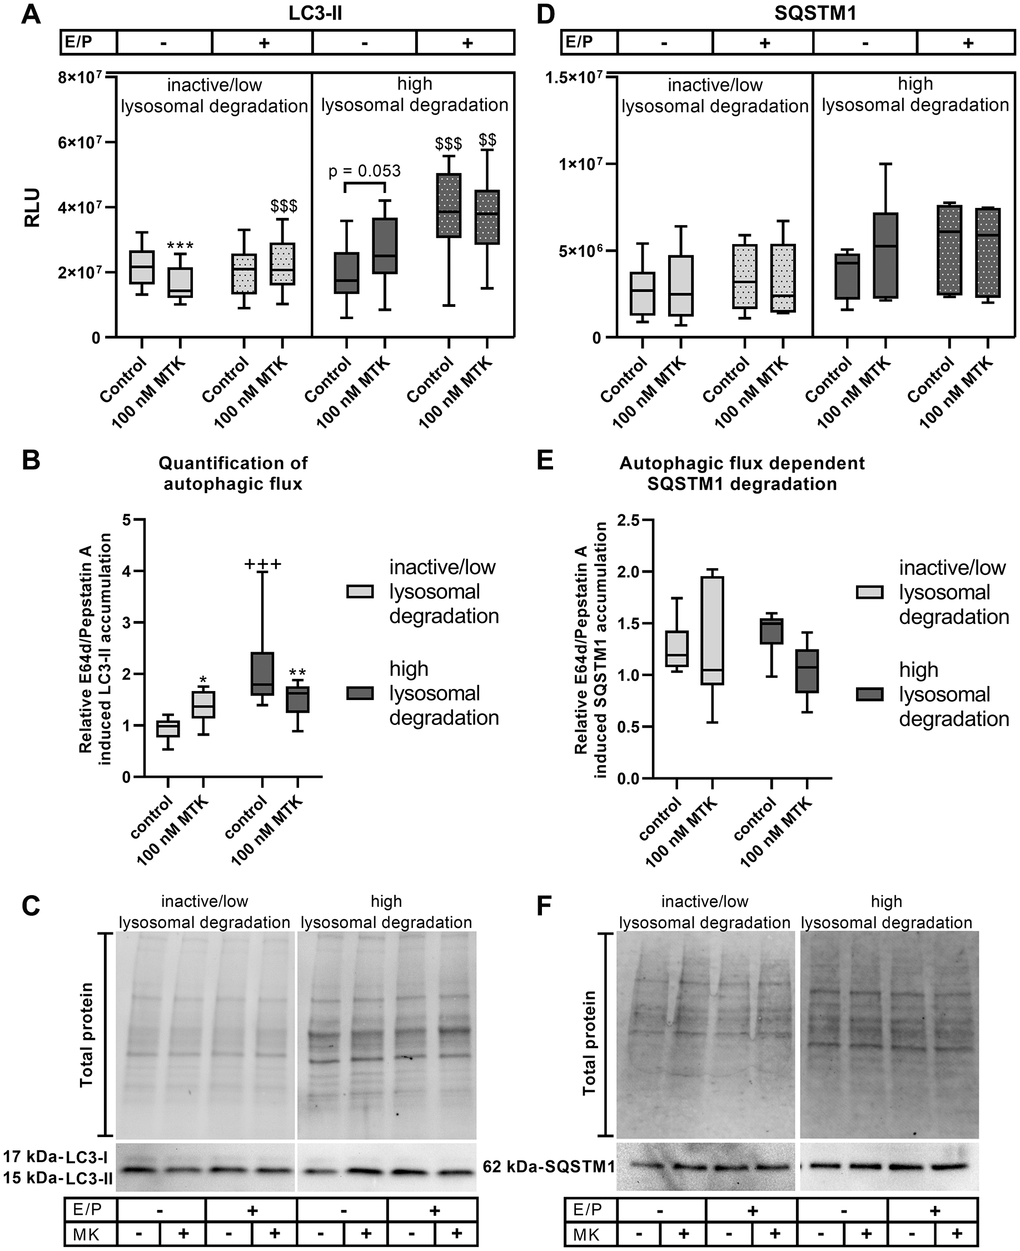
Figure 3.LC3-II and SQSTM1 protein expression in polarized ARPE-19 cells treated with MTK. (A) RLUs of LC3-II normalized to the amount of total loaded protein in polarized ARPE-19 cells treated with 100 nM MTK for 3 h in the absence and presence of lysosomal inhibitors E64d and pepstatin A (E/P). (B) Relative E64d/pepstatin A-induced LC3-II accumulation in control and MTK-treated polarized ARPE-19 cells. (C) Representative western blot analysis showing total protein loading, LC3-I and LC3-II expression in polarized ARPE-19 cells treated with MTK in the absence and presence of lysosomal inhibitors E/P. (D) RLUs of SQSTM1 normalized to the amount of total loaded protein in polarized ARPE-19 cells treated with 100 nM MTK for 3 h in the absence and presence of lysosomal inhibitors E/P. (E) Relative E64d/pepstatin A-induced SQSTM1 accumulation in control and MTK-treated polarized ARPE-19 cells. (F) Representative western blot analysis showing total protein loading and SQSTM1 expression in polarized ARPE-19 cells treated with MTK in the absence and presence of lysosomal inhibitors E/P. Western blot images are cropped showing areas of marked primary antibody interaction only. Samples were grouped into inactive/low (autophagic flux of control <1.2) and high (autophagic flux of control ≥1.2) lysosomal degradation groups. Values are represented in box and whisker plot format (min to max); LC3-II: n = 8–10, SQSTM1: n = 6. The significance of differences (A, D) in LC3-II and SQSTM1 expression upon MTK treatment was calculated for both groups by repeated measures two-way ANOVA (main factors: lysosomal inhibition (matched) and MTK treatment (matched)) followed by a Tukey multiple comparison test. ***p < 0.001 compared to the control, $$$p < 0.001, $$p < 0.01 compared to the sample without lysosomal inhibition. The significance of differences in relative E64d/pepstatin A-induced (B, E) LC3-II and SQSTM1 accumulation upon MTK treatment was calculated by repeated measures two-way ANOVA (main factors: inactive/low and high lysosomal degradation and MTK treatment (matched)) followed by a Sidak multiple comparison test. **p < 0.01, *p < 0.05 compared to control, +++p < 0.001 compared to inactive/low lysosomal degradation sample.