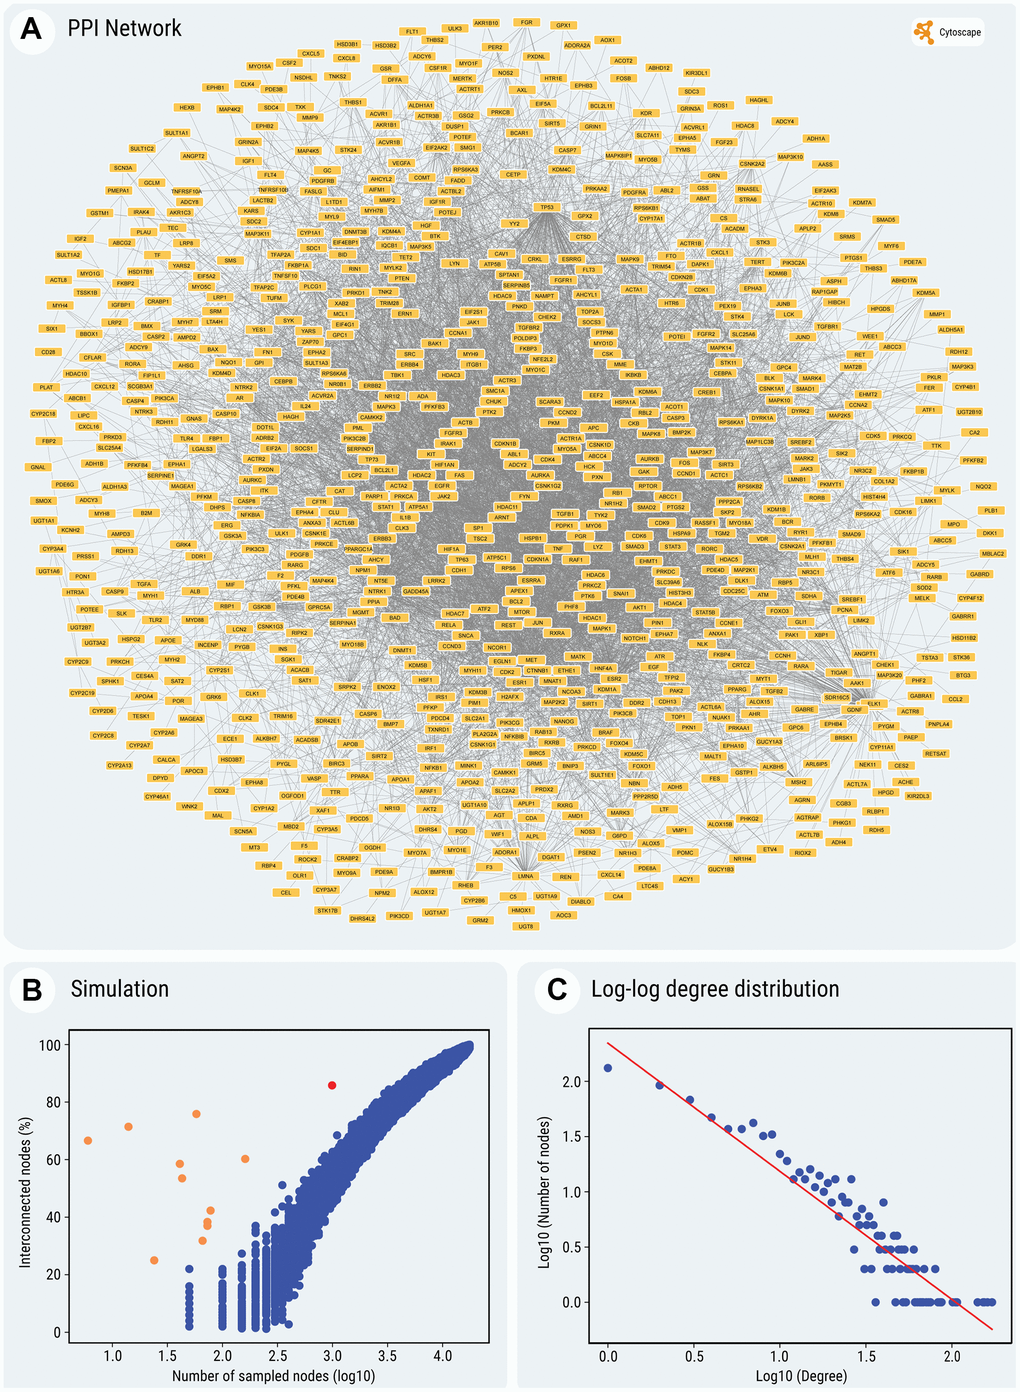
Figure 3.(A) Graphical output of the PPI network of the entire set of SMs' targets. (B) Simulation of expected interconnectivity given the size of a random sample. The observed interconnectivity of SMs' gene targets in the interactome, depicted by the red dot in the scatter plot and the observed interconnectivity of cocktails' gene targets, depicted by the orange dots, can be compared to the percentage of interconnected nodes (on the Y-axis), found in the largest continuous component of the network, for randomly sampled node sets. The plot shows the sampling of subsets of random interactome nodes, of various sizes (represented in a log10 scale on the X-axis, from 50 to 17,600 nodes). For each step, the interconnectivity was computed 100 times. Simulations were performed only for samples larger than 50 nodes, because of the increased variability of very small node sets. (C) The log-log plot of P(k) against k, illustrating scale-free topology of the network (for details, see the text and Methods). For all the nodes and edges in the network see Supplementary Table 9. (A, C) The construction and display of the network and the degree distribution regression were performed using Cytoscape, which pulls physical PPIs data determined in vitro and in vivo from the BioGRID database.