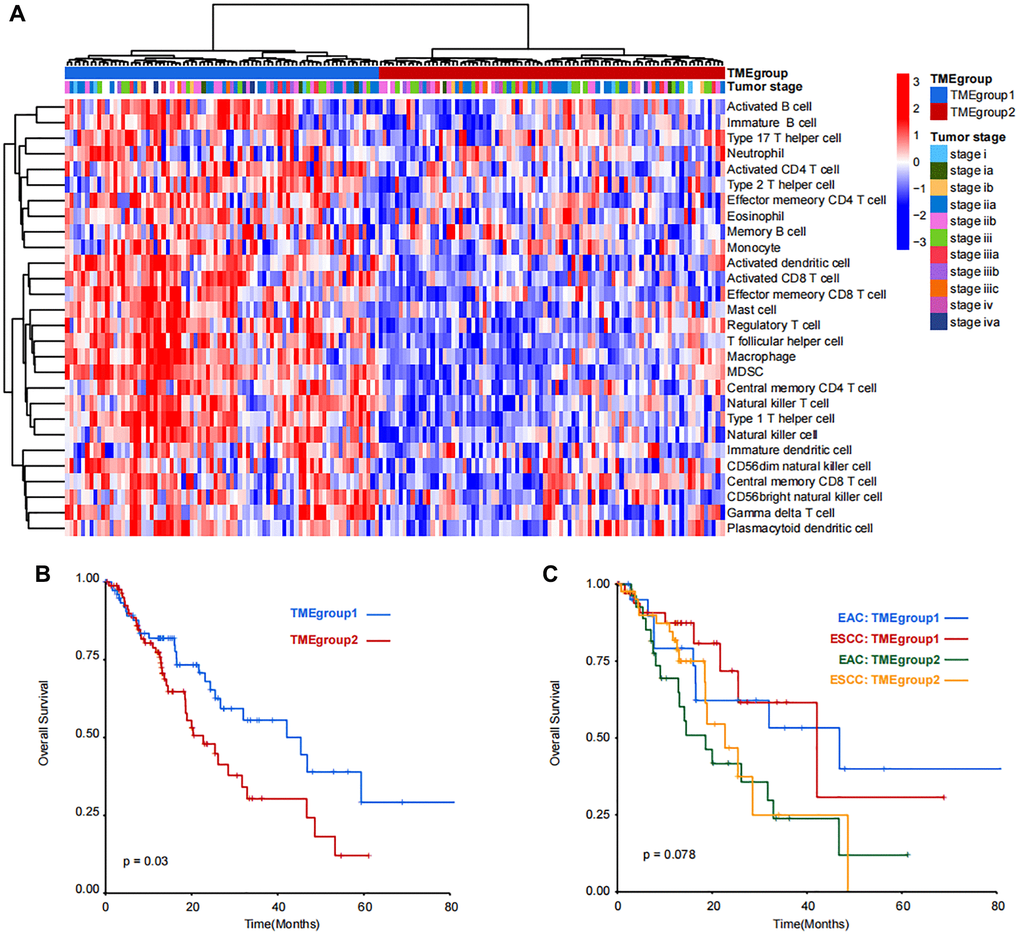
Figure 2.Unsupervised clustering and prognostic analysis of immune cell populations in TCGA-ESCA dataset. (A) Patients were divided into TMEgroup1 and TMEgroup2 by unsupervised clustering of 28 kinds of TME cells. TMEgroups and tumor stage of each patient are marked on the top of the heatmap. The color bar corresponds to the normalized enrichment score of TME cells. (B) Kaplan-Meier plot showing the overall survival of patients in TMEgroup1 (line in blue) and TMEgroup2 (line in red). (C) Kaplan-Meier plot showing the overall survival of patients in TMEgroup1 and TMEgroup2 between EAC and ESCC subtypes.