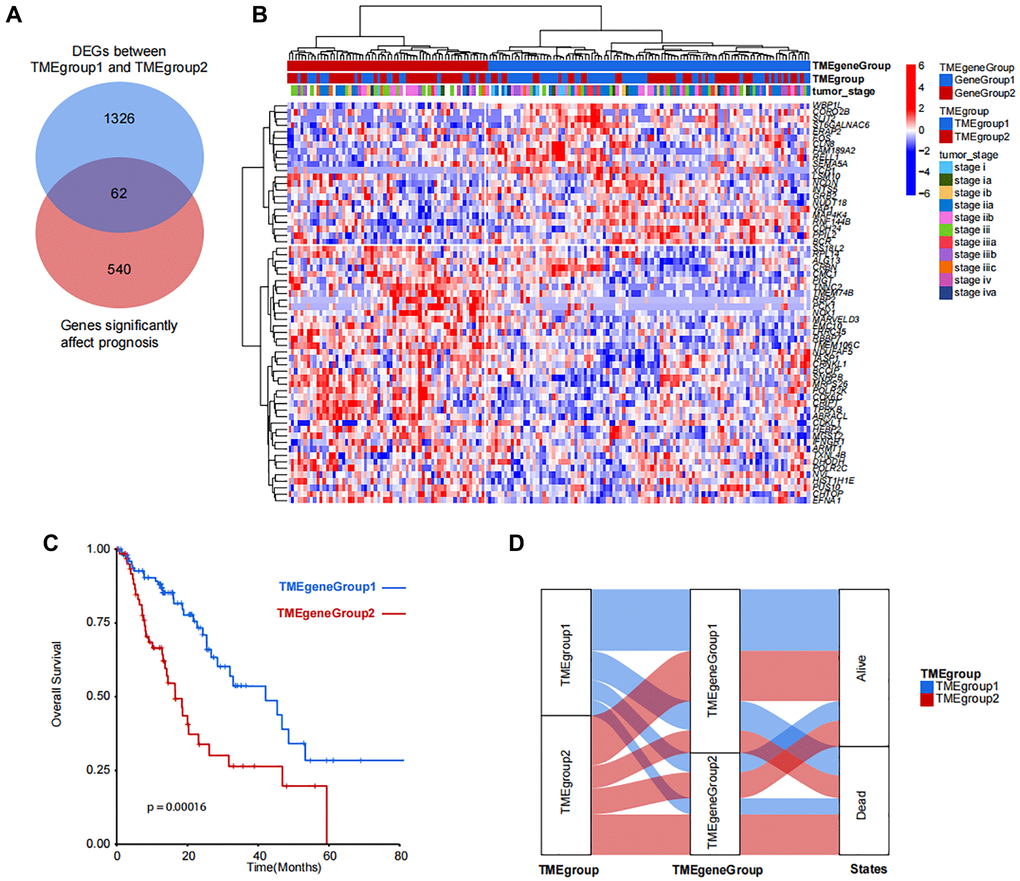
Figure 3.Identification and clustering of TMEgroup and prognosis correlated genes. (A) Venn diagram shows the number of genes significantly affect prognosis and DEGs between predefined TMEgroups. (B) Unsupervised clustering of 62 genes shows the 2 clusters of patients. TMEgeneGroups, TMEgroups and tumor stage of each patient are marked on the top of the heatmap. The color bar corresponds to the normalized expression value of signature genes. (C) Kaplan-Meier plot showing the overall survival of TMEgeneGroup1 (line in blue) and TMEgeneGroup2 (line in red). (D) Sankey diagram showing the proportional relationship in TMEgroup substyles, TMEgenegroup substyles and the patient survival states.