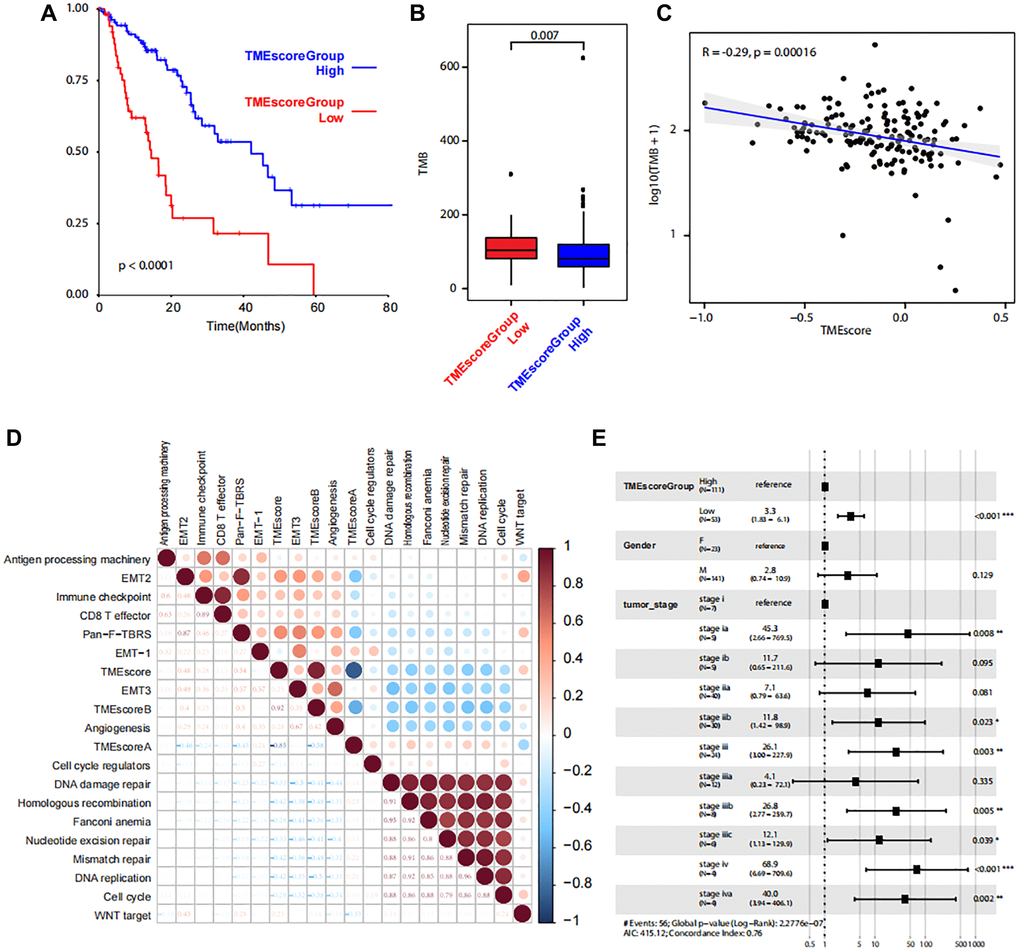
Figure 5.Correlations between TMEscore and patient prognosis. (A) Kaplan-Meier plot shows significant difference of the overall survival between the two groups with high and low level of TME scores. (B) Box plot shows TMB between the two groups with high and low level of TME scores. (C) Line regression shows the correlation between TMEscore and TMB. R value and P values are also labelled. (D) The correlation between cancer related pathways and TMEscore. The size and color correspond to the correlation values. (E) The multivariate Cox regression model shows the correlations between TMEscore and clinical phenotypes.