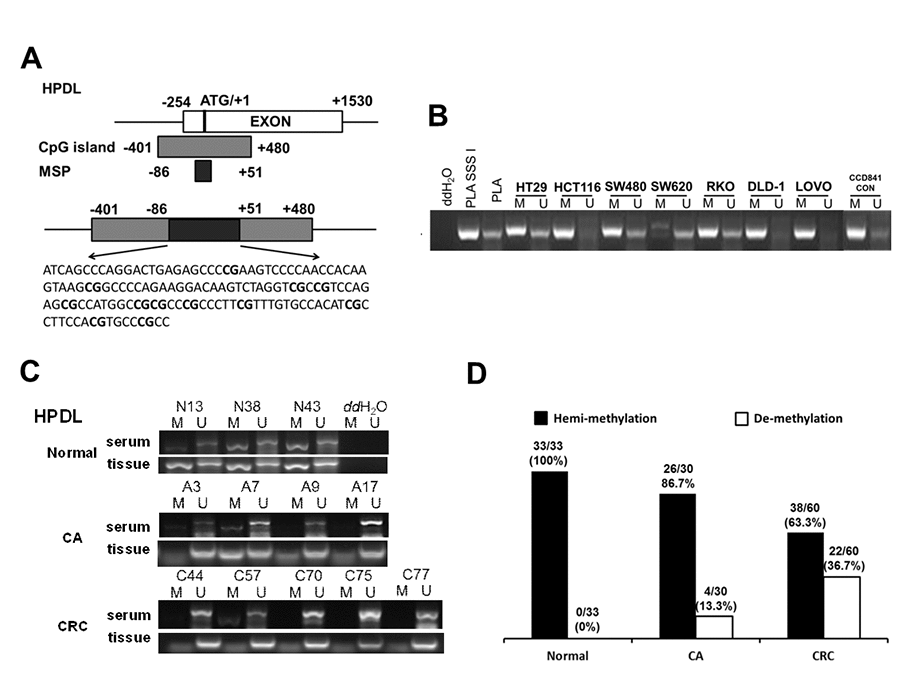
Figure 4.Serum de-methylated HPDL in CRC, CA patients and healthy controls. (A) Schematic illustration of the gene structure of HPDL, the CpG island region and the position of MSP primers. (B) Detected HPDL methylation status in 8 cell lines. Placental DNA (or treated by SSSI) represented a positive control of de-methylated or methylated status. Abbreviations: M: methylation; U: un-methylation. (C) Representative serum and tissue methylation status of HPDL in CRC, CA patients and healthy controls. (D) Frequency of serum HPDL methylation status in 60 CRC, 30 CA patients and 33 healthy controls.