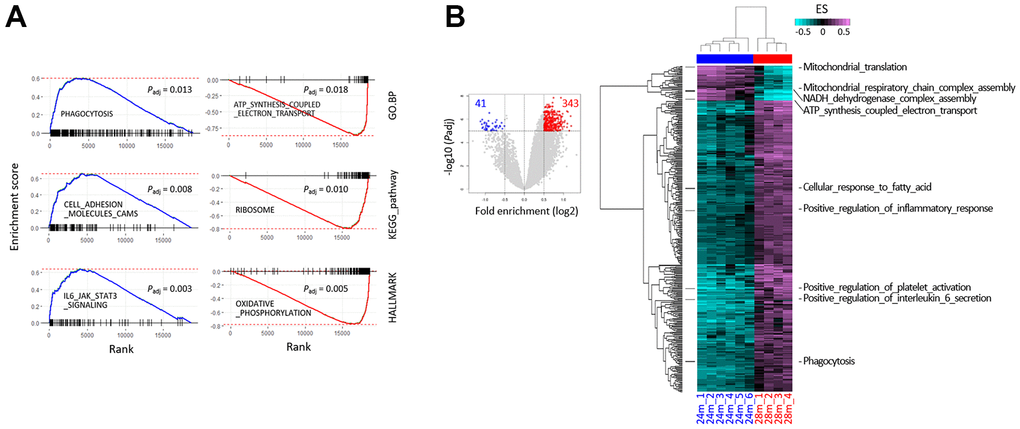
Figure 2.Gene set enrichment analysis (GSEA) using RNA-sequencing data from the skeletal muscle of 24- and 28-month-old mice. (A) The GSEA mountain plots representatively show significant enrichment (left) or depletion (right) of genes, for the indicated gene sets and collections. The thick blue and red lines indicate the running enrichment scores across the fold change-ranked genes (Rank), in comparison to the RNA-seq gene-level expression at 28 over 24 months. Black vertical tick marks below or above the curve indicate the location of individual target genes within the fold change-ranked gene list. Adjusted P-values (Padj, Benjamin and Hochberg-corrected enrichment statistics) are indicated. (B) Single-sample GSEA with gene sets showing differential enrichment in the skeletal muscle of 24- and 28-month-old mice. Using GSVA, single-sample GSEA was performed on GO.BP collection from MSigDB (v7.0; see Supplementary Figure 1 for other collections). The volcano plot shows the distribution and the number of gene sets with differential enrichment (DE; FDR < 1 × 10⁻⁵, log2 fold-enrichment > 0.5) between the 24 and 28 months; each dot indicates a gene set in GO.BP MSigDB collection and blue and red dots for depleted and enriched in the 28 months, respectively. The numbers in red and blue indicate the gene set numbers enriched and depleted in 28m samples, respectively. Heatmaps show differential enrichments among individual 24m and 28m samples. Samples were hierarchically clustered on the x-axis (28m, red; 24m, blue) in an unsupervised manner, and significant DE gene sets are shown on the y-axis. Black bars on the left represent the gene sets shown in Figure 4C, and the names of the gene sets are denoted on the right. Colors in the GSVA score bar indicate enrichment scores in individual samples.
Figure 2 — Different phases of aging in mouse old skeletal muscle | Aging