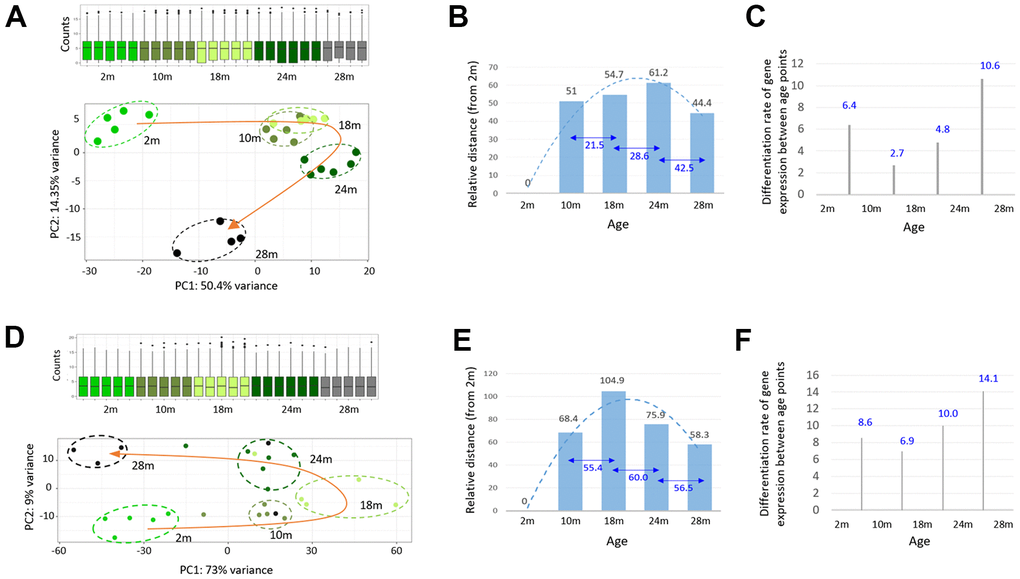
Figure 3.A steep change in the transcriptome of skeletal muscle during the late phase of aging. (A, D) Principal component analysis of the skeletal muscle (A) and peripheral blood mononuclear cell (PBMC); (D) RNA-seq data from 2-, 10-, 18-, 24-, and 28-month-old mice. Transcriptomes of different age groups are marked by different colors. The curved orange arrow connects the group mean transcriptome of each age group to show an age-associated change in the gene expression profile of the skeletal muscle. Box plots show the distribution of normalized counts. (B, E) Measurement of the group mean transcriptomic distance / variance of each age group, relative to the 2-month group (numbers in black) or among the age groups (numbers in blue). (C, F) Per-month differentiation of transcriptomes between the age groups, which divides the transcriptomic distance by the age (month) difference.