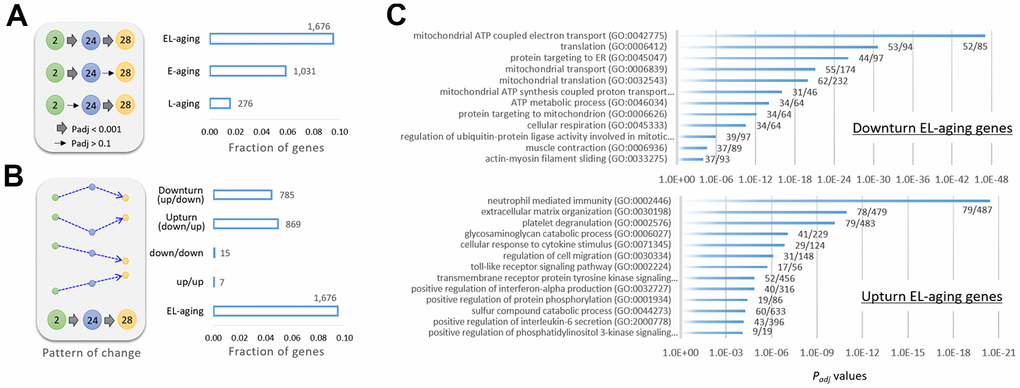
Figure 4.Classification of genes by age-associated expression pattern. (A) Gene categories of E-aging genes, L-aging genes, or EL-aging genes that show significant changes in expression levels during E-aging or L-aging, or in both phases (EL-aging), respectively. The thick arrow in the illustration indicates a significant change (Padj < 0.001) among the age groups, whereas the thin arrow indicates no significance (Padj > 0.1). (B) Further classification of the EL-aging genes by the pattern (dotted arrows in blue) of change in expression level with age. The number of genes in each category is indicated on the graph. (C) Gene ontology result using 785 downturn (top) and 869 upturn EL-aging genes (bottom). The fractional numbers indicate the number of EL-aging genes over the whole genes in the corresponding gene set.