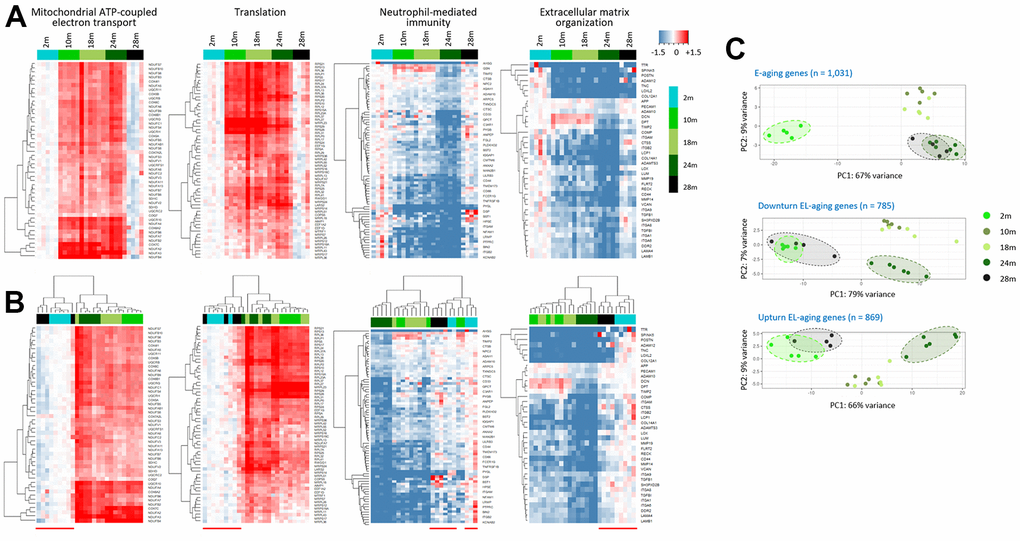
Figure 5.Assimilation of the EL-aging gene expression profiles of the skeletal muscle in super elderly mice with those in the young mice. (A, B) Heatmaps of EL-aging genes for expression levels of individual muscle samples relative to the mean level of the 2-month group. Age-associated expression changes in four representative gene sets are shown by unsupervised (A) or supervised hierarchical clustering (B) Red line below the heatmap in B indicates the cluster of 2m and 28m samples. (C) Comparison of transcriptomes of E-aging (top) and EL-aging genes (bottom) among the age groups. A close similarity is shown in the 24m (dark green) and 28 samples (black) for the E-aging gene group, whereas it was in the 2m (light green) and 28m samples for the EL-aging gene group and their down- and upturn subsets.