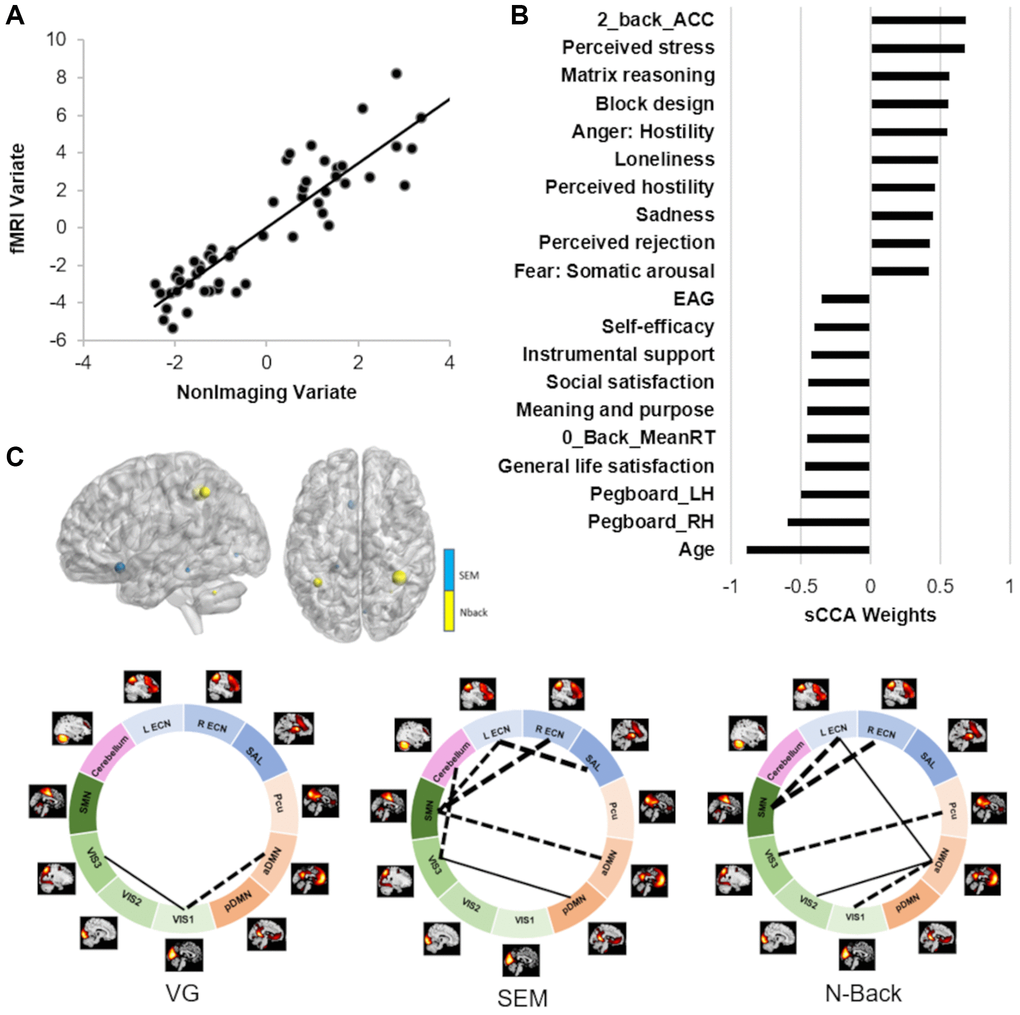
Figure 3.Results of the sCCA between non-imaging and fMRI datasets across all participants. (A) Significant correlation across all participants (r = 0.91, p = 0.0004). (B) Top behavioral–health variables most strongly associated with the imaging variate. (C) Top fMRI features most strongly associated with the non-imaging variate. Dashed lines between networks indicate negative contributions of the FNC; solid lines between networks indicate positive contribution of the FNC. Details in Supplementary Tables 3 and 5.