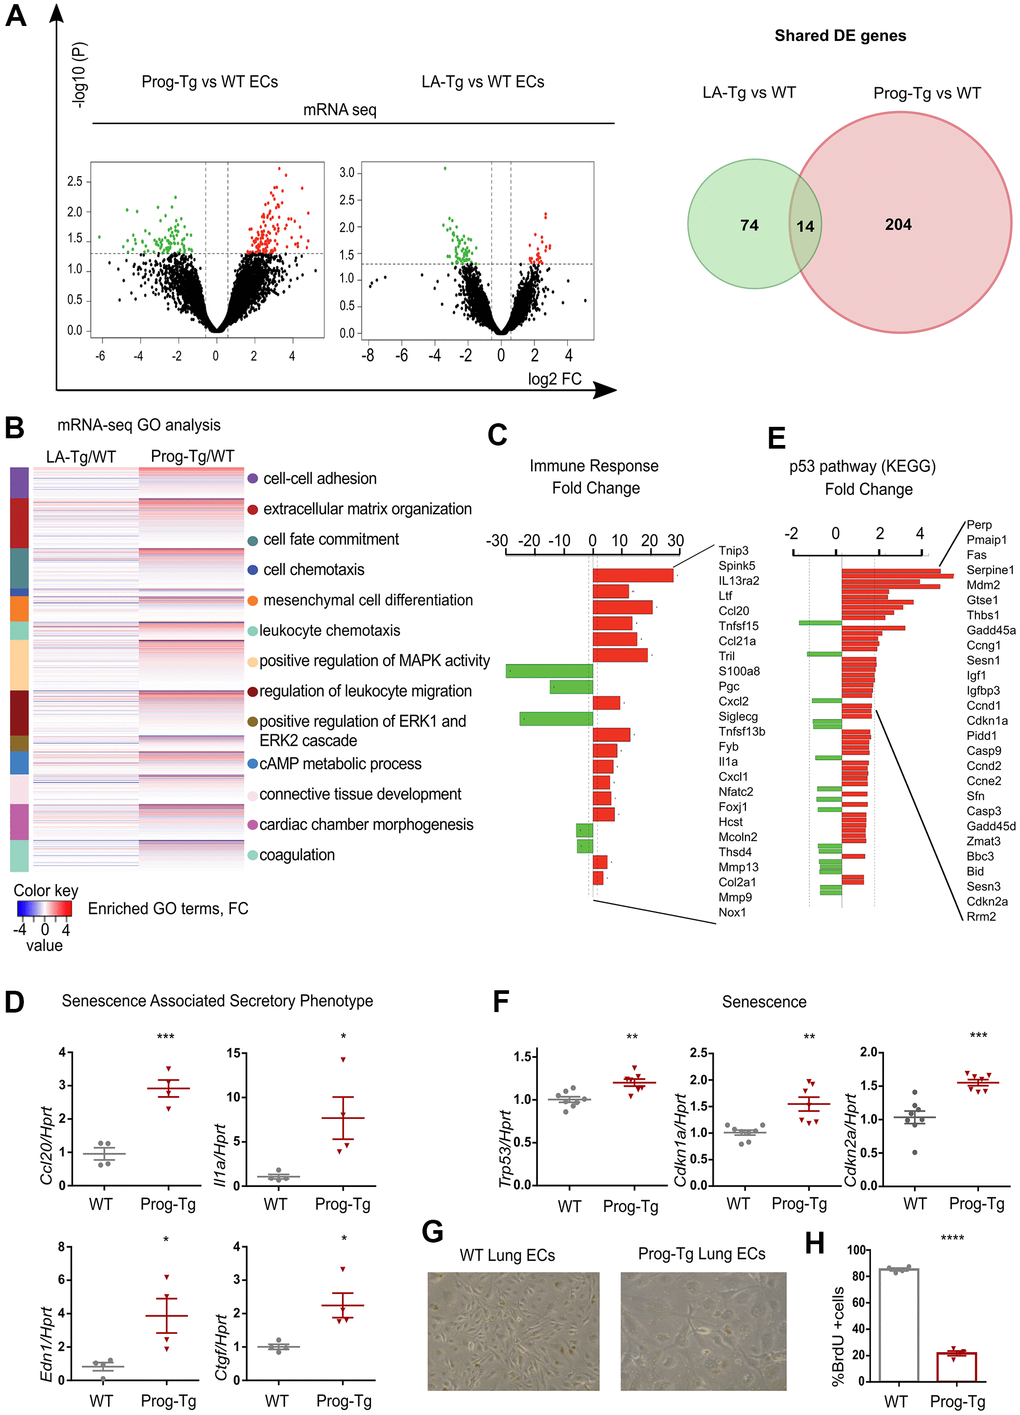
Figure 1.Progerin expression in endothelial cells activates senescence and SASP. (A) Volcano plots depicting differential expression (DE) analysis of genes in Prog-Tg/WT and LA-Tg/WT lung endothelial cells (ECs, left panel). Red, upregulated-, green, downregulated genes; X-axis, log2 values of fold change (FC>1,5 and <-1.5) and y-axis, -log10 values of p-value (p<0.05, n=3) (left panel). Analysis of shared DE genes between Prog-Tg/WT and LA-Tg/WT depicted by Venn diagrams (right panel). (B) Heatmap displaying enriched Gene Ontology (GO) terms of the whole ranked list of DE genes in Prog-Tg/WT and control group LA-Tg/WT using topGO and GOstats packages in R/Bioconductor. (C) Enriched GO term “Immune response” exhibiting significantly DE genes in Prog-Tg/WT lung ECs. (D) qPCR analysis of Ccl20, Il1a, Edn1 and Ctgf in Prog-Tg/WT lung ECs using Hprt as reference gene. (E) KEGG pathway analysis of the “p53 pathway” enriched term showing DE genes in Prog-Tg/WT ECs. (F) qPCR analysis of Trp53, Cdkn1a and Cdkn2a in Prog-Tg/WT lung ECs using Hprt as reference gene. (G) Representative images from WT and Prog-Tg lung ECs at passage 2. (H) Bromodeoxyuridine incorporation assay (BrdU) performed for 40 h using Prog-Tg and WT lung ECs (n=4). For qPCR and BrdU assay, comparisons were performed between Prog-Tg and WT. For qPCRs n=4-8. Statistics were performed using unpaired two-tailed Students t test, *p<0.05, **p<0.01, ***p<0.001, ****p<0.0001.