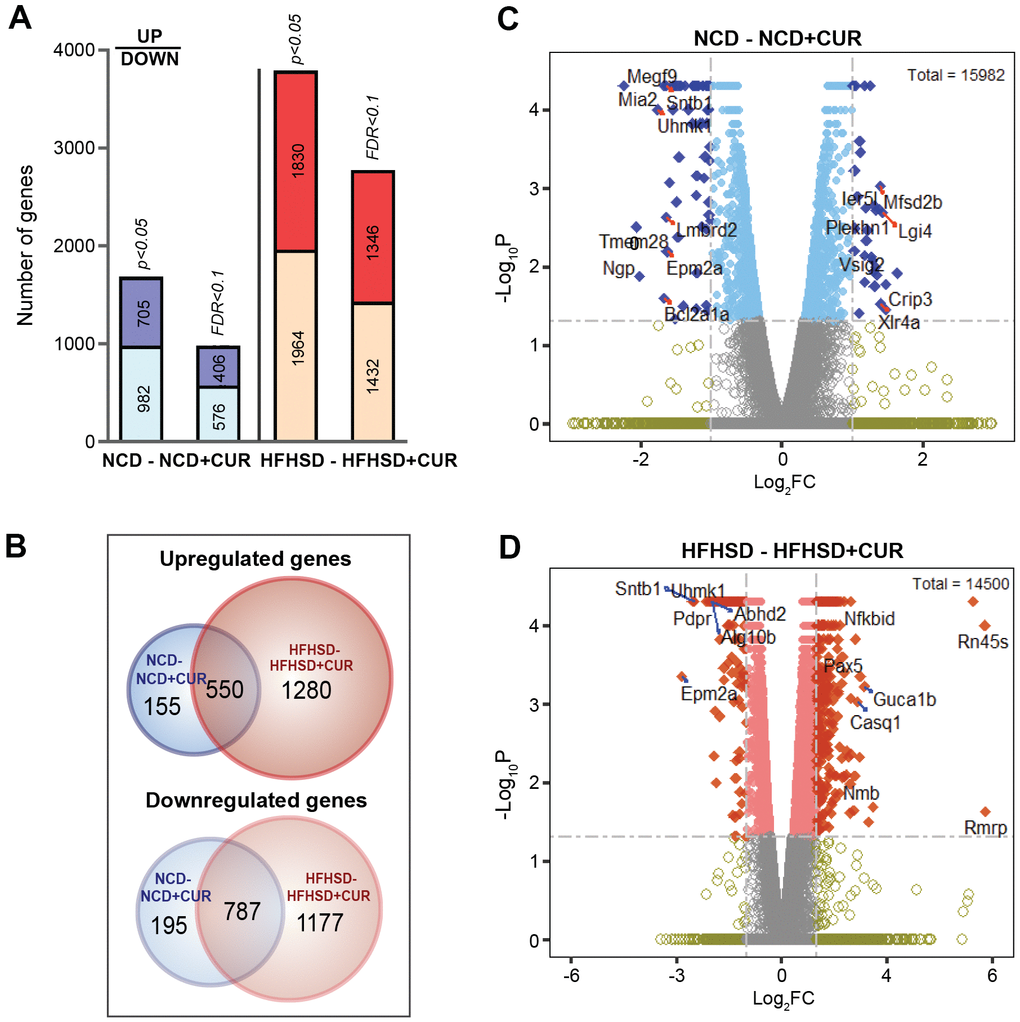
Figure 2.Liver RNA sequencing transcriptome profiling in NCD, NCD+CUR, HFHSD, and HFHSD+CUR fed aged mice. (A) Number of differentially regulated genes (DEGs) as defined by p-value and False Discovery Rate (FDR)-defined cut-offs are presented for comparisons of mice groups that received curcumin-supplemented normal control diet (NCD+CUR) and high-fat, high-sugar diet (HFHSD+CUR) to their non-supplemented NCD/HFHSD counterparts (n = 3 per group). The bottom part represents downregulated genes and the top part, upregulated genes. (B) Venn Diagrams represent overlapping and distinct gene expression between the comparison groups for upregulated (top) and downregulated (down) genes. (C, D) The number of genes with ≥ 2 log2 fold change (FC; represented as dark blue or dark orange) and p-value < 0.05 are indicated in volcano plots for two different comparisons.