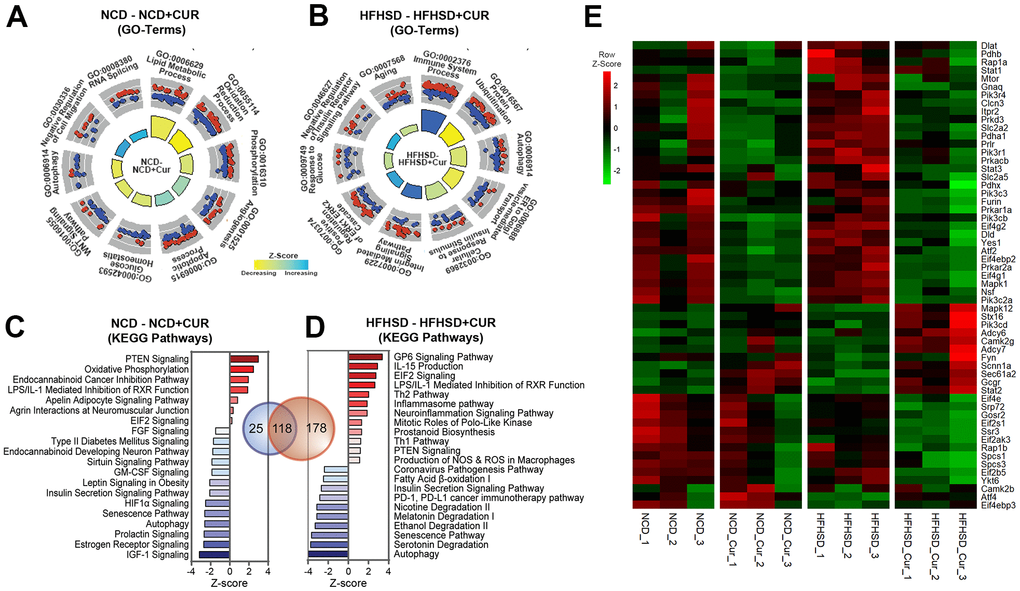
Figure 3.RNA sequencing analysis of the liver reveals that curcumin supplementation regulates a broad array of genes related to aging and insulin homeostasis. (A,B) Significant Gene Ontology (GO)-Biological Processes enriched in Differentially Expressed Genes (DEGs) in aged mice liver receiving curcumin-supplemented normal control diet (NCD+CUR) or high-fat, high-sugar diet (HFHSD+CUR) compared with their respective non-supplemented control groups (NCD or HFHSD) (n = 3 per group). The relevant top 10 GO-terms are presented in the GO Circle plots. Within each GO-Term, the upregulated and downregulated genes are represented in red and blue circles. The breadth of inner rectangles represents the strength of p-value significance. Yellow color represents GO-Terms with negative Z-scores and blue, positive Z-scores. (C, D) Bar charts of top significantly affected canonical pathways based on IPA presented based on the Z-scores. The red color indicates activation, and the blue color indicates suppression. (E) Heatmap analysis of insulin signaling pathway: Heatmap of RNA expression is measured by FPKM (p < 0.05 in HFHSD comparison; FPKM > 1.5) from Insulin Receptor and Insulin Secretion signaling pathways. Red indicates a positive Z-Score and green, negative Z-score.