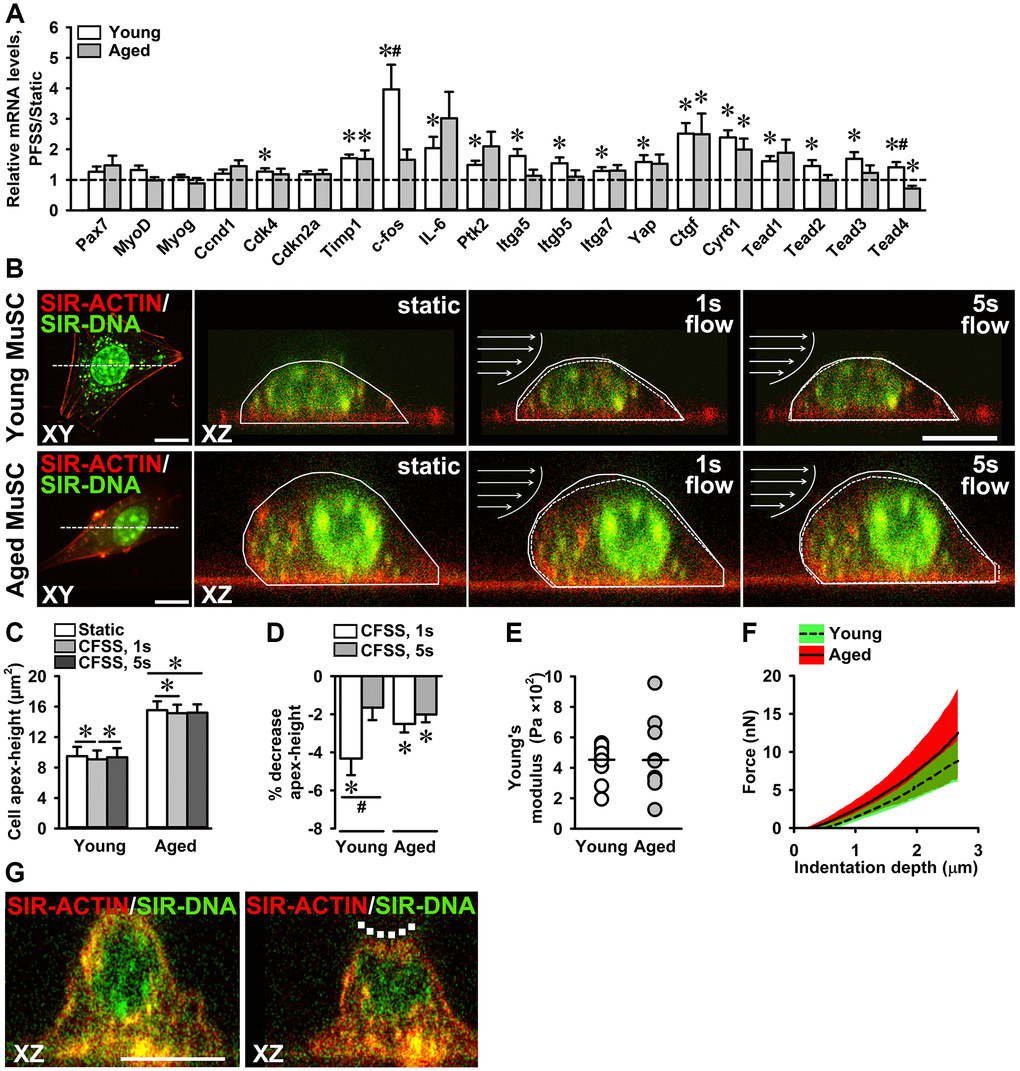
Figure 7.Attenuated mechanosensitivity to PFSS in aged MuSCs. (A) MuSC gene expression in response to PFSS, showing upregulation of Cdk4, Timp1, c-fos, IL-6, Ptk2, Itga5, Itgb5, Itga7, Yap, Ctgf, Cyr61, Tead1, Tead2, Tead3, and Tead4, in young MuSCs, and Timp1, Ctgf, and Cyr61 in aged MuSCs. Young MuSCs, n = 10 (from 4 young mice). Aged MuSCs, n = 8 (from 3 aged mice). (B) Confocal top view (XY) and cross-sectional (XZ) live cell images of young and aged MuSCs stained for F-actin filaments (red), and nuclei (green), before (static) and during (1 s, 5 s) fluid shear stress treatment, illustrating the change in cell apex-height as a result of fluid shear stress. The change in cell apex-height is highlighted with solid and dotted lines in XZ images. Arrows indicate the direction of fluid flow (C, D) CFSS induced MuSC deformation and decreased the cell apex-height of young and aged MuSCs at the start of CFSS treatment (1 s). Aged MuSCs remained deformed after 5 s of treatment, whereas young MuSCs regained their initial cell apex-height. Young MuSCs, n = 13 (from 3 young mice). Aged MuSCs, n = 10 (from 3 aged mice). (E) Nano-indentation of MuSCs revealed a similar Young’s modulus (~450 Pa) of young and aged MuSCs. The coefficient of variation was large in aged MuSCs (61%) compared to young MuSCs (27%). (F) Force-indentation curves showing large variation in force required to indent aged MuSCs compared to young MuSCs. (G) Confocal cross-sectional micrographs of young MuSC stained for F-actin filaments (red) and nucleus (green) before and during nano-indentation, illustrating cell deformation (dotted line). Young and aged MuSCs, n = 10 cells (from 1 young mouse and 1 aged mouse). Abbreviations: MuSCs: muscle stem cells; PFSS: pulsating fluid shear stress; CFSS: constant fluid shear stress. Values are mean ± SEM. *Significant effect of PFSS, p < 0.05. #Significant difference between age groups, p < 0.05. Scale bar; 10 μm.