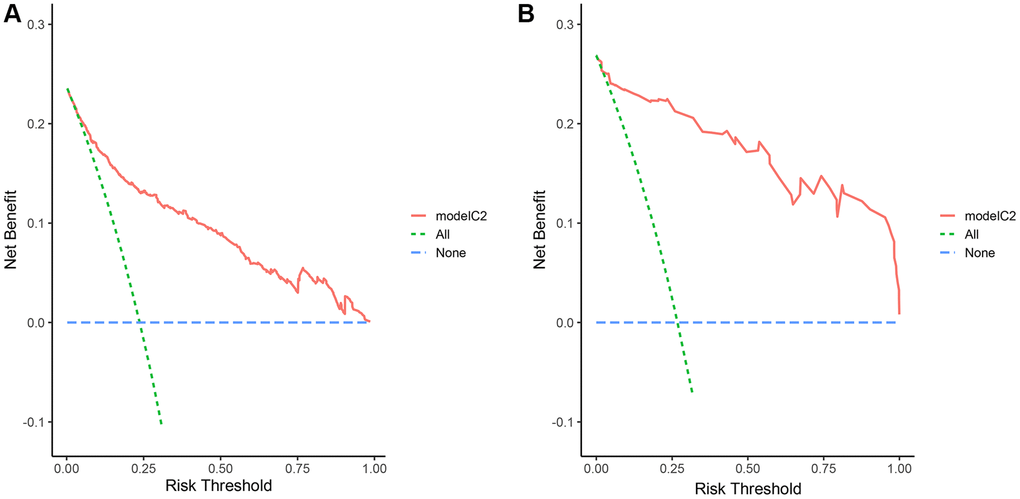
Figure 4.DCA curves of the nomogram. DCA compares the net benefits of three scenarios in prewarning the severe disease occurrence: A perfect prediction model (blue line), screen none (horizontal green line), and screen based on the nomogram (red line). The DCA curves were depicted in the training cohort (A), validation cohort (B).