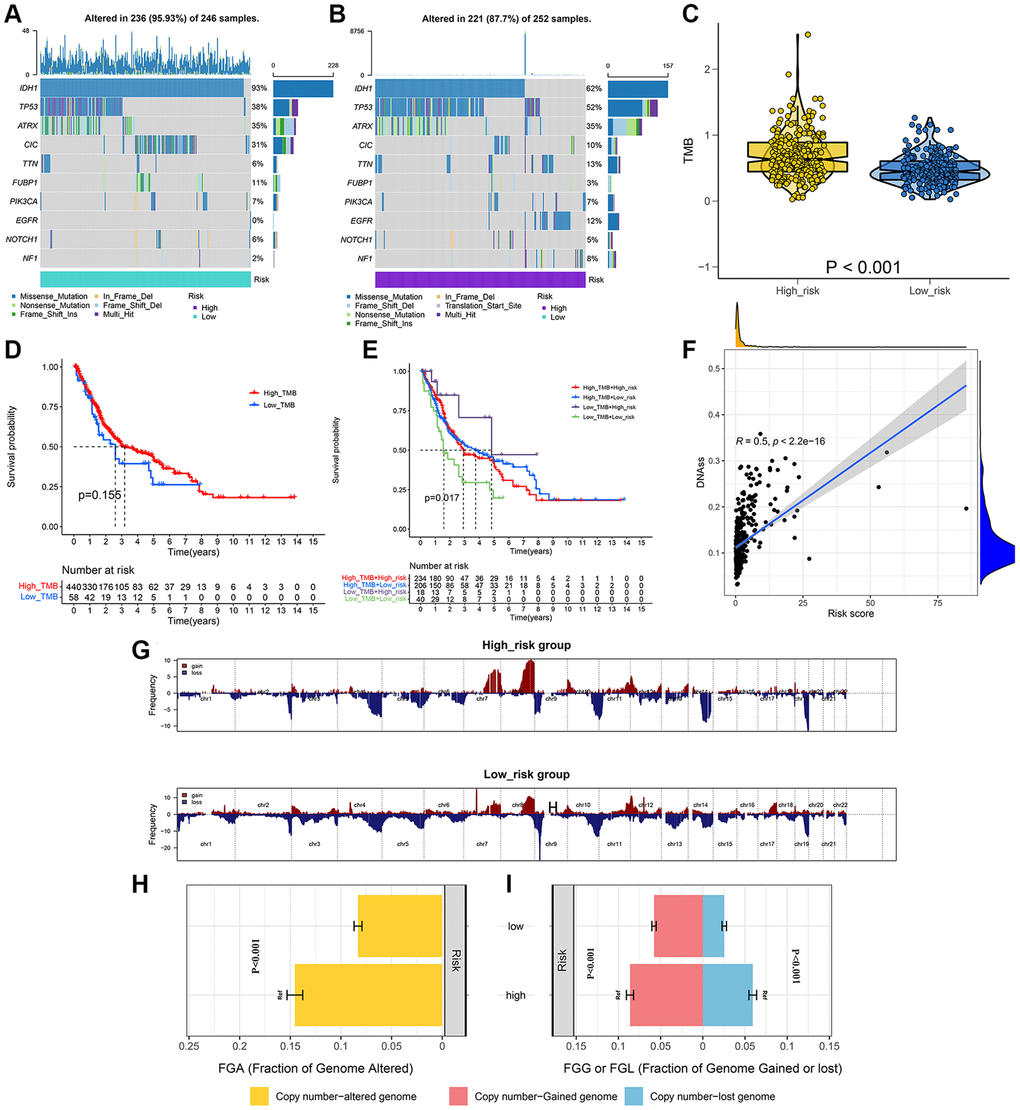
Figure 6.Integrated comparisons of somatic mutation and CNVs between high-risk and low-risk groups in the whole set. (A, B) Waterfall plots showing the mutation information of top 10 genes with the highest mutation frequency in two groups. (C) Distribution of TMB in two groups. (D) Survival curves for the OS of the high-TMB and low-TMB groups. (E) Survival curves for patients stratified by both TMB and signature. (F) Relationship between risk score and DNAss. (G) Gene fragments profiles with amplification (red) and deletion (blue) among the two groups. (H, I) Comparison of the fraction of the genome altered, lost, and gained between the two groups.