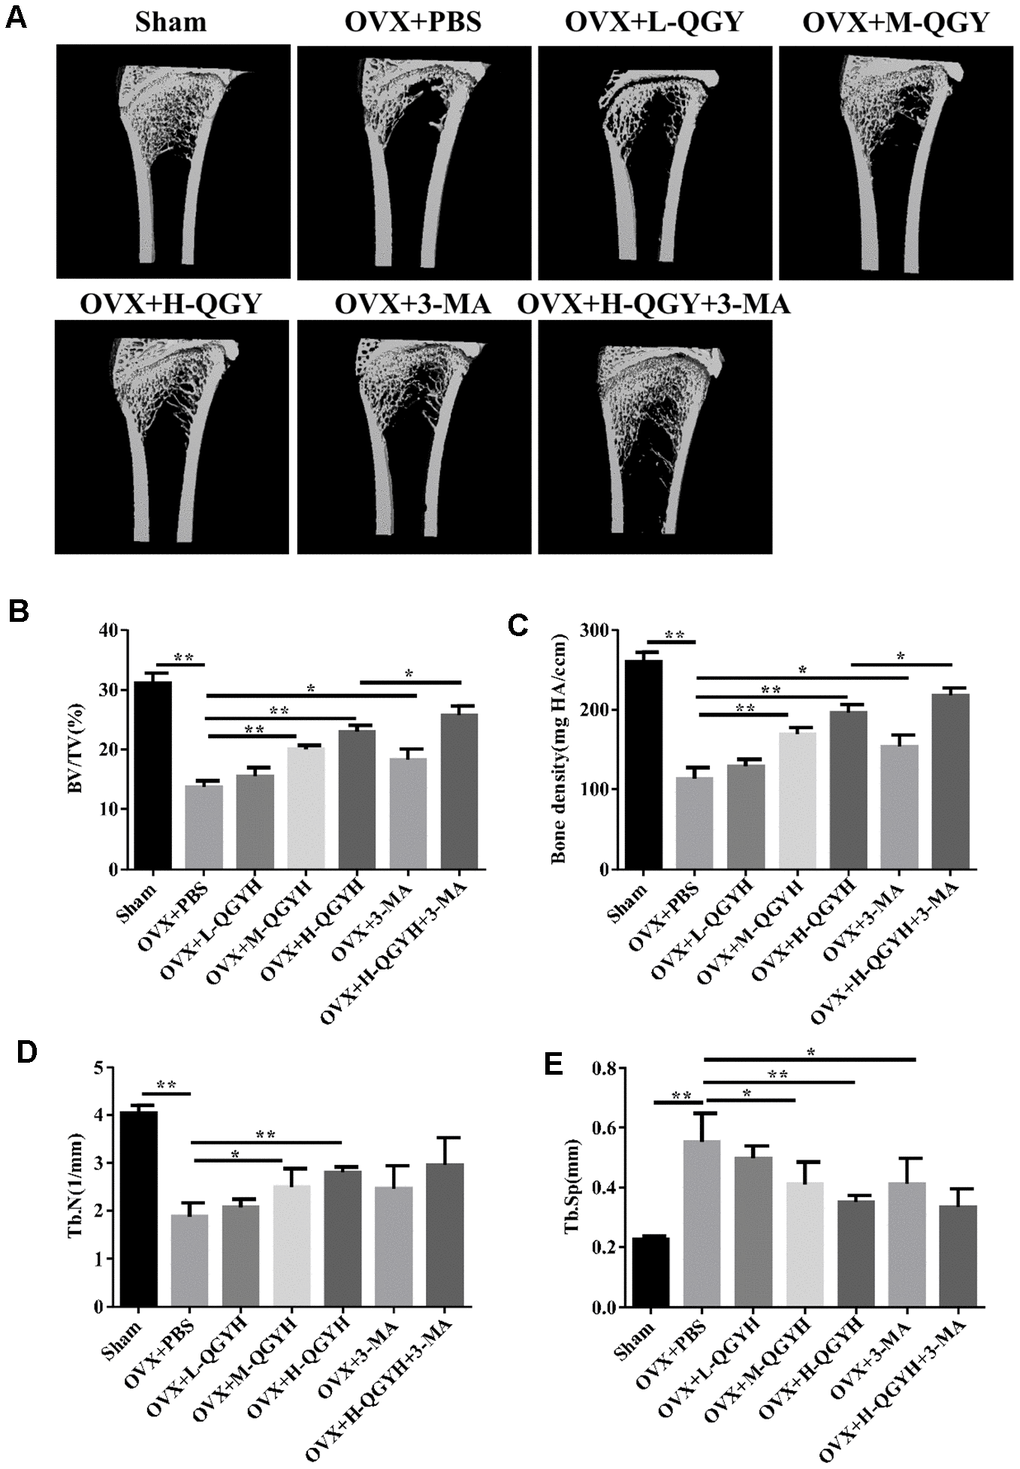
Figure 1.Micro-CT analysis after treating with QGY in animal model. Ovariectomy (OVX) was performed in rats, and then different doses of QGY were given to the rats. (A) Representative figures of three-dimensional micro-CT analysis. (B–E) Quantitative analysis of bone trabecular volume fraction (BV/TV, %) (B), bone density (BMC/TV) (C), bone trabecular number (Tb.N) (D) and bone trabecular spacing (Tb.Sp, mm) (E) in three-dimensional micro-CT analysis. The data are presented as the means ± SD (n=5). *p<0.05, **p<0.01. One-way ANOVA followed by Tukey's post hoc test.