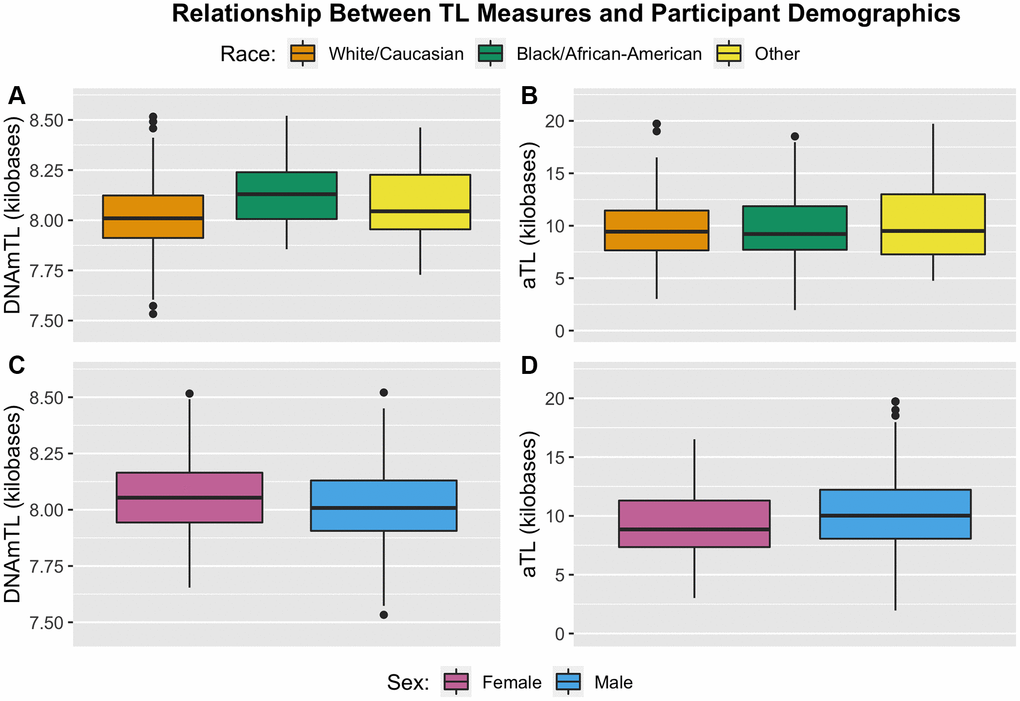
Figure 3.Boxplots illustrating distribution of TL measures by participant demographic factors of race (top) and sex (bottom). (A) DNAmTL partitioned by racial status. (B) aTL partitioned by racial status. (C) DNAmTL partitioned by sex. (D) aTL partitioned by sex.