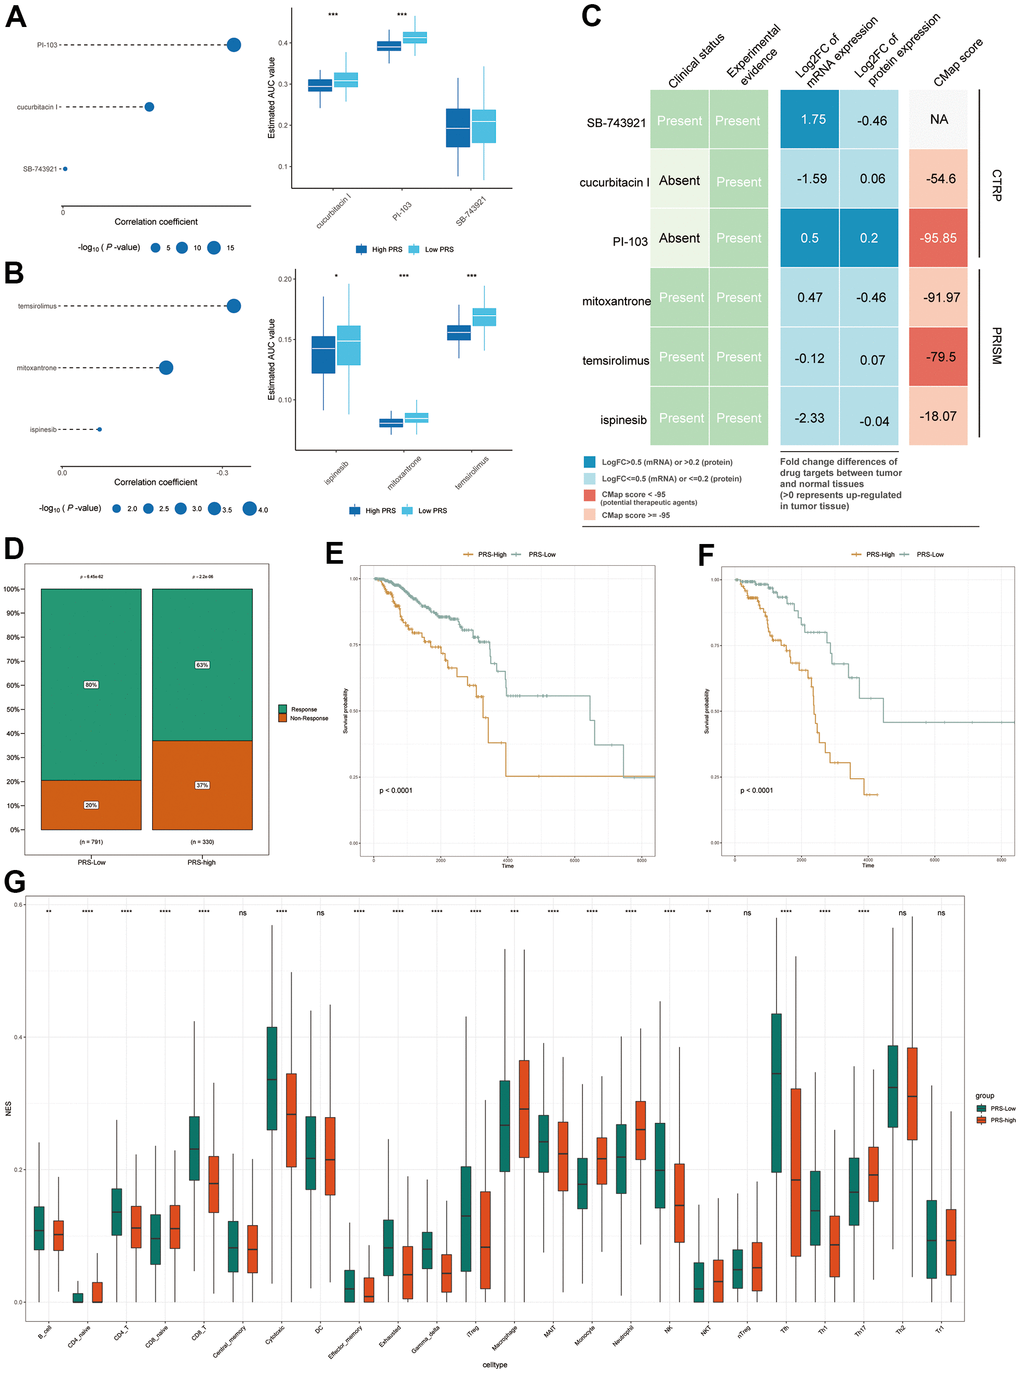
Figure 7.Response to chemotherapy and immunotherapy of high- and low-IRS patients. (A, B) The bubble plot shows the degree of negative correlation between AUC values and PRS scores of three CTRP-derived compounds (A) and three PRISM-derived compounds (B). Longer lines in the graph indicate a stronger negative correlation, predicting greater drug sensitivity. Boxplots indicate the results of differential drug response analysis between the PRS high and PRS low groups for the three CTRP-derived compounds (A) and the three PRISM-derived compounds (B). Note that lower values on the y-axis of boxplots imply greater drug sensitivity. (C) Evidence from multiple sources to identify the most promising therapeutic agents for the high-IRS group. Six compounds come from CTRP and PRISM are shown on the diagram, respectively. (D) Proportion of immune-responsive and nonimmune-responsive populations in the PRS high- and low-expression groups. (E, F) Survival analysis graph showing differences in survival between PRS-high and IRS-low groups in nonimmune-responsive (E) and immune-responsive (F) patients. (G) Differences in immune infiltration scores of 24 immune cell types in high and low PRS groups in TCGA database. * means p <0.05, ** means p <0.01, *** means p<0.005, **** means p<0.001.