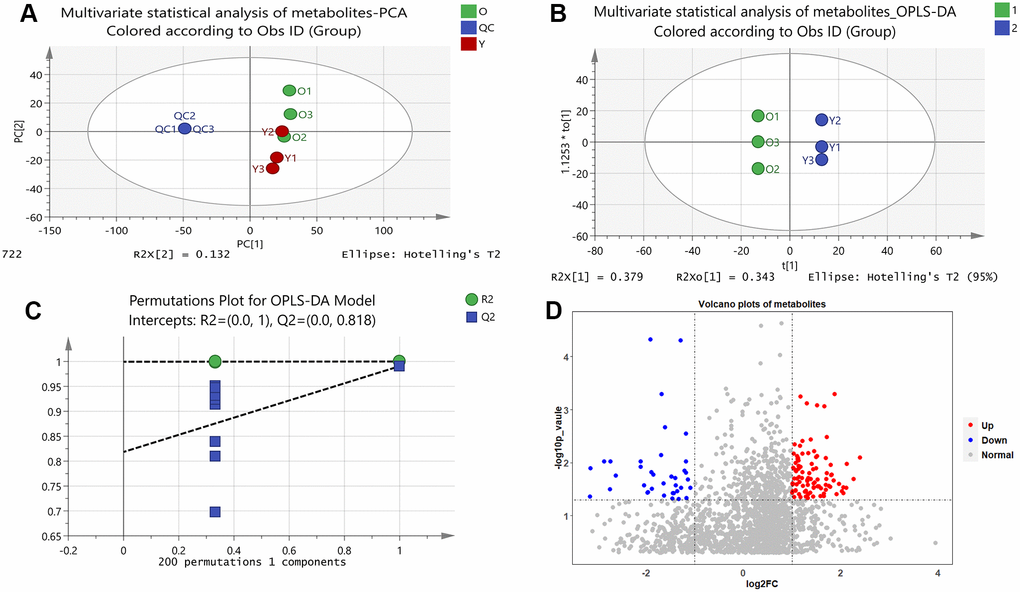
Figure 1.Results of multivariate statistical analysis of metabolomics. (A) Multivariate statistical analysis of metabolites-PCA. PC1 and PC2 represent the degree of interpretation of the model with the first and second principal component ranking in the principal component analysis. (B) Multivariate statistical analysis of metabolites-OPLS-DA. The separation of the two classes of observations occurs in the horizontal (t1) direction; The vertical (t1o) direction indicates intra-class variability. (C) Permutations Plot for OPLS-DA Model. For the selected Y variable, the figure shows the R2 and Q2 values of the original model (far right) on the vertical axis; The horizontal axis shows the correlation between the substituted Y vector and the original Y vector of the selected Y. (D) Volcano plots of metabolites. The red dots represent up-regulated metabolites and the blue dots represent down-regulated metabolites, and the grey dots represent that the metabolites were not significantly changed.