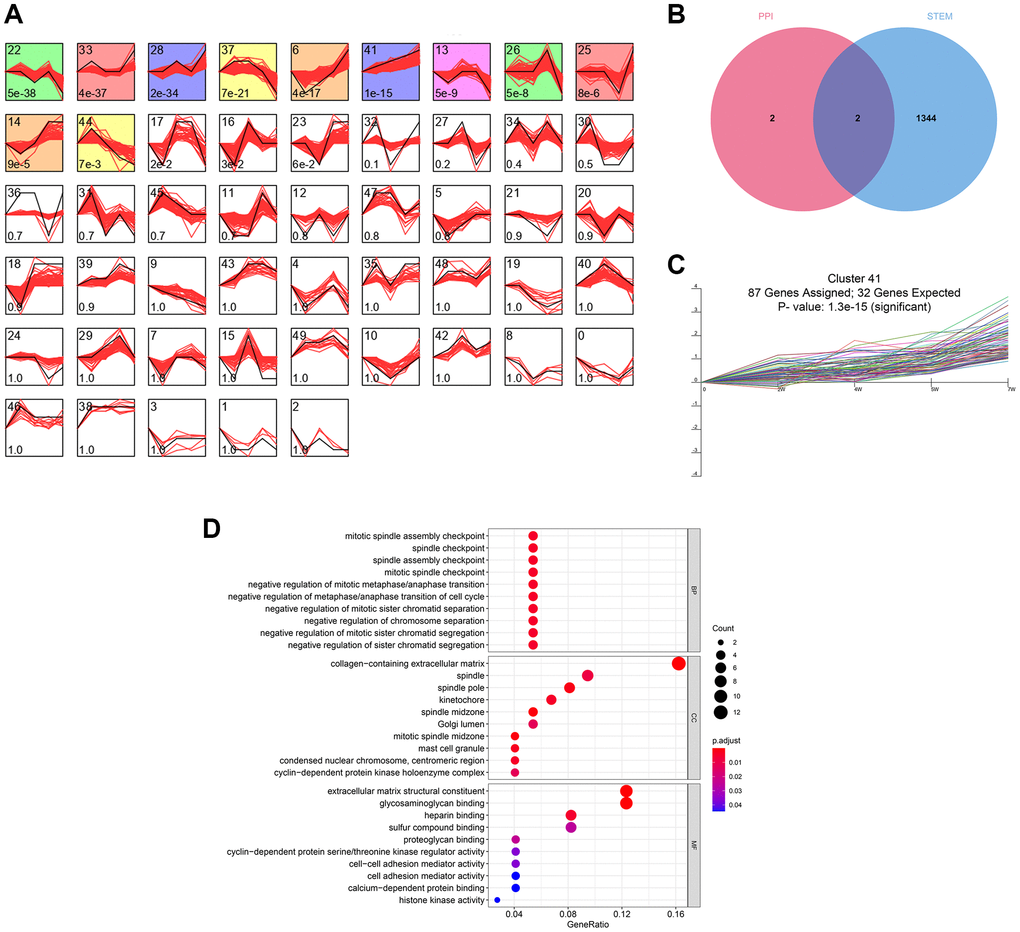
Figure 3.The time-series analyses. (A) 11 gene clusters were identified. The number at bottom-left in each cell represent the P-value and the number at top-left is the gene cluster ID. (B) FN1 and POSTN were con-determined by the network analysis and the time-series analysis. (C) FN1 and POSTN were encompassed in cluster 41, of which the P-value <0.001. (D) The GO functional annotation of the gene cluster 41. Abbreviation: GO: gene ontology.