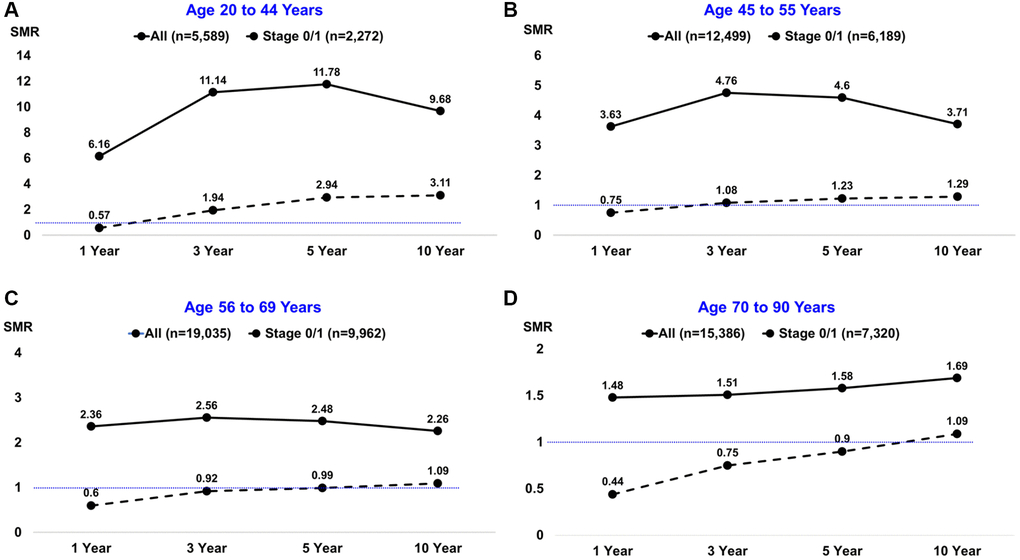
Figure 1.Standardized mortality ratios (SMRs) by age group at breast cancer diagnosis and different follow-up intervals. The solid black line depicts all patients; the dashed black line depicts the subset of patients diagnosed with stage 0/1 disease. The horizontal thin blue line depicts SMRs below or above the null value of 1.0.