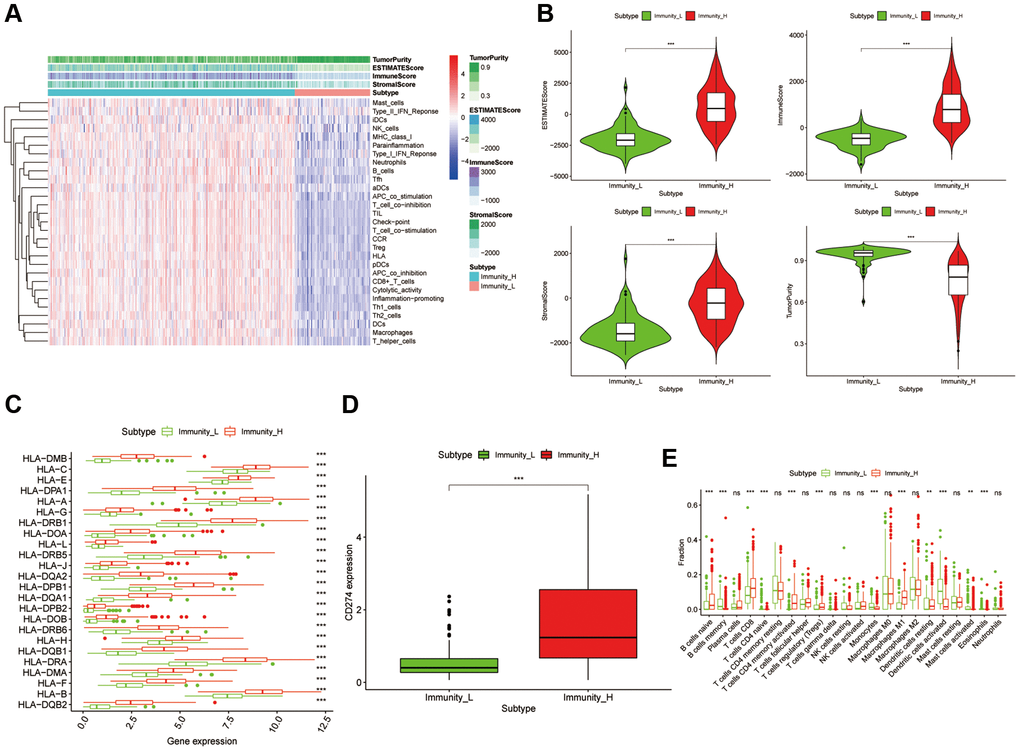
Figure 1.Construction and verification of bladder cancer clustering by immune infiltration. (A) The immune cells were highly infiltrated in the cluster1 group, which was named as the Immunity_H (high immune cell infiltration group), and the low expression one in the cluster2 group was named as the Immunity_L (low immune cell infiltration group). The Tumor Purity, ESTIMATE Score, Immune Score and Stromal Score of each sample gene were also displayed with the grouping information by using ESTIMATE's algorithm. (B) The box-plot showed a statistical difference in Tumor Purity, ESTIMATE Score, Immune Score and Stromal Score between the two groups (p < .01). (C and D) In Immunity_H (red), the expression of HLA family genes and CD274 were all significantly higher than that in the Immunity_L (green) (p < 0.001). (E) The statistical chart showed the proportion difference of each immune cell between the Immunity_H (red) and the Immunity_L (green), after using the CIBERSORT method.