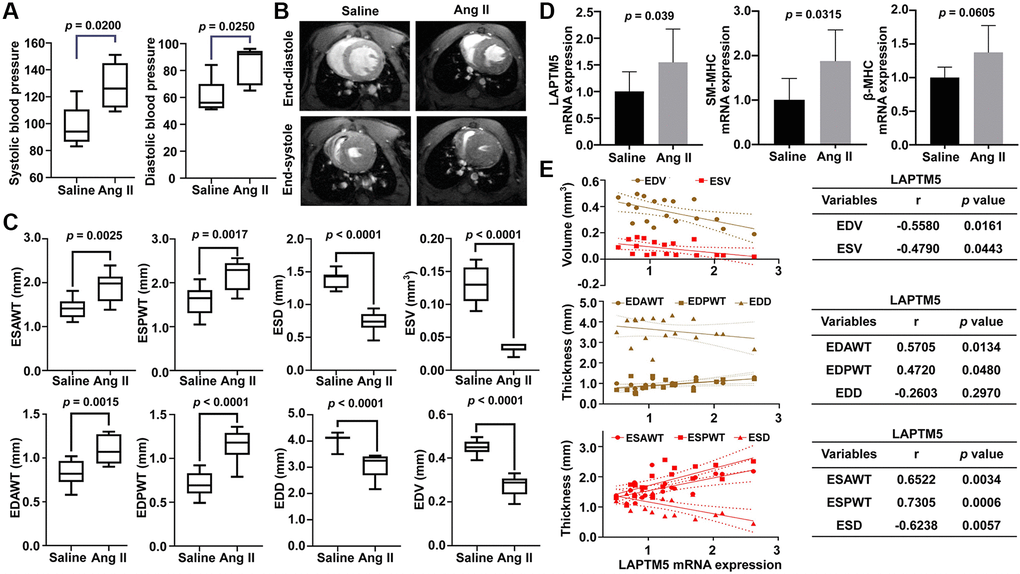
Figure 10.Assessment of Ang II infusion-induced HT with LVH mouse model. (A) Blood pressure measurement in Ang II-treated mice for 7 days. DBP represents diastolic blood pressure, while SBP indicates systolic blood pressure. (B) Representative end-diastolic and end-systolic cine MR images of LV from saline- and Ang II-treated mice for 7 days. (C) Quantitative changes in ESAWT, ESPWT, ESD, ESV, EDAWT, EDPWT, EDD, and EDV were compared between the two groups of mice. ESAWT, end-systolic anterior wall thickness; ESPWT, end-systolic posterior wall thickness; ESD, end-systolic diameter; ESV, end-systolic volume; EDAWT, end-diastolic anterior wall thickness; EDPWT, end-diastolic posterior wall thickness; EDD, end-diastolic diameter; EDV, end-diastolic volume. (D) RT-PCR analysis of the mRNA expression of LAPTM5, SM-MHC, and β-MHC between the two groups. (E) The Pearson correlation analysis between LAPTM5 and cardiac structural parameters of LV. The bottom table shows the correlation coefficients and p values. EDV, end-diastolic volume; ESV, end-systolic volume; EDAWT, end-diastolic anterior wall thickness; EDPWT, end-diastolic posterior wall thickness; EDD, end-diastolic diameter; ESAWT, end-systolic anterior wall thickness; ESPWT, end-systolic posterior wall thickness; ESD, end-systolic diameter.