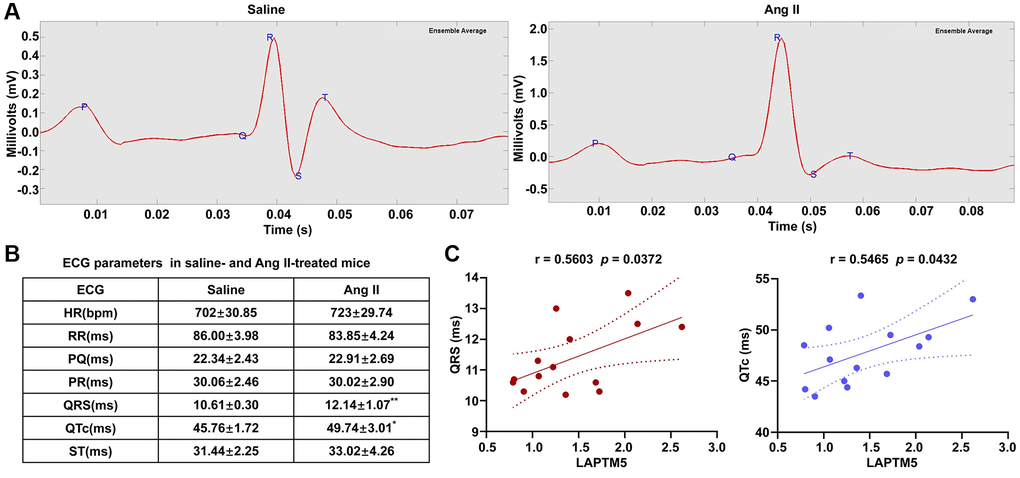
Figure 11.ECG evaluation in Ang II infusion–induced HT with the LVH mouse model. (A) Representative ECG recordings from saline- and Ang II-treated mice for 7 days. (B) Table shows the different of ECG parameters in saline- and Ang II-treated mice for 7 days (*p < 0.05, **p< 0.01, ***p < 0.001). (C) Analysis of Pearson’s correlation between LAPTM5 and the widths of the QRS complex and the QTc interval.