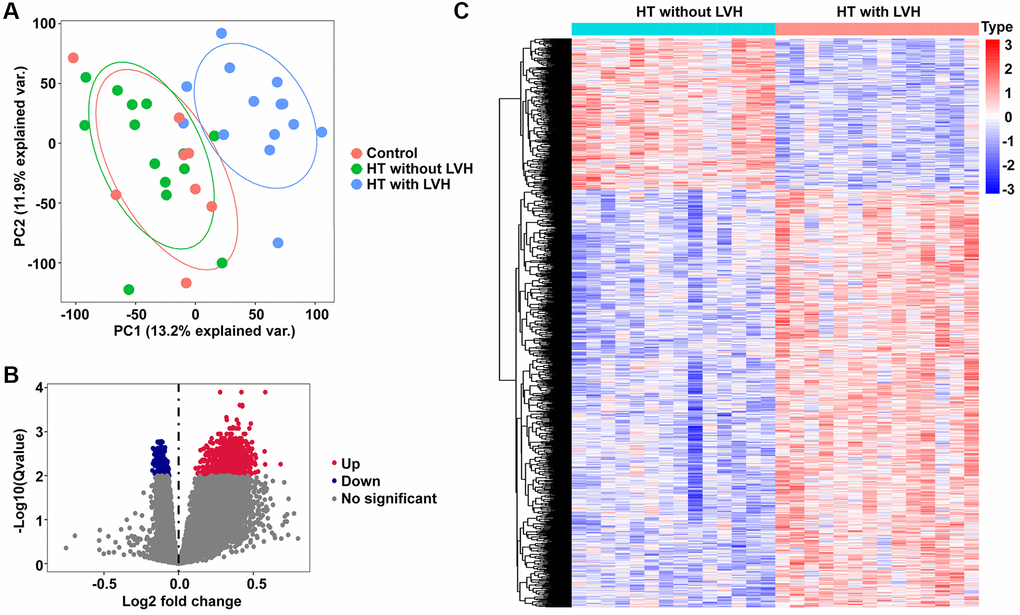
Figure 2.PCA and DEGs identification. (A) The PCA plots for all the subjects. Red nodes represent the Control sample cluster, green nodes designate the HT without LVH sample cluster, and blue nodes indicate the HT with LVH sample cluster. (B) Volcano plots of differential gene profiles between HT with LVH and non-LVH groups. Grey nodes represent genes that are not differentially expressed, red nodes represent significantly upregulated genes, and blue nodes indicate significantly downregulated genes in HT with LVH. (C) Heat map of all the DEGs between HT with LVH and non-LVH. Red exhibits overexpression, while blue indicates lower expression of genes in hypertensive LVH.