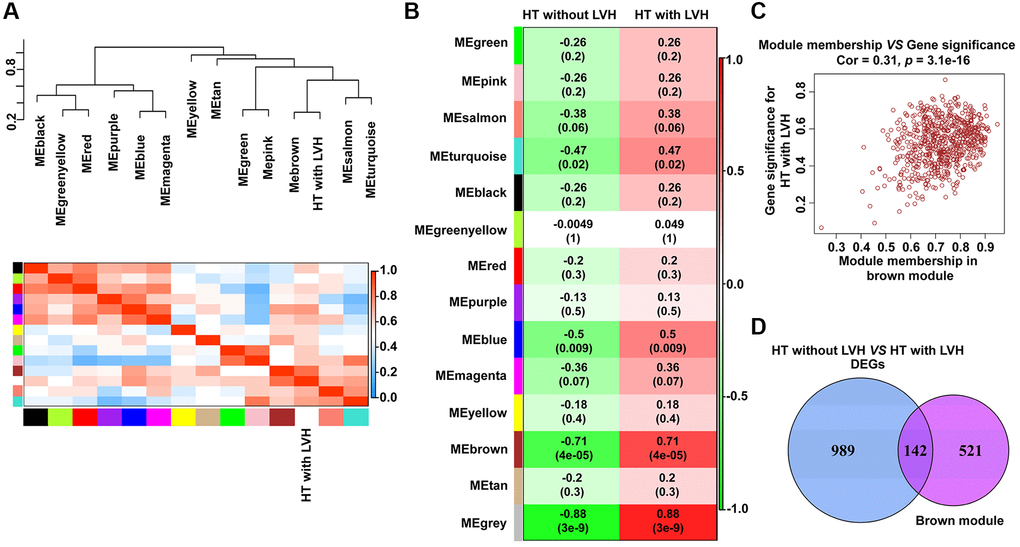
Figure 3.Identification of modules with clinical traits (HT without LVH or HT with LVH) in WGCNA. (A) The dendrogram shows the relation of modules with HT with LVH and the heat map shows the eigengene adjacency. (B) Heat map of the relationship between the module eigengenes and clinical traits (HT without LVH or HT with LVH). Module names are displayed on the left, and each column corresponds to a clinical trait. The number in the first row in each cell represents the Pearson correlation coefficient, and the p value of the corresponding module-trait is exhibited in parentheses. The color of each cell indicates the degree of correlation. (C) Scatterplot of correlation between MEbrown membership and gene significance for hypertensive LVH. The correlation coefficient and p value are listed above the scatterplots. One dot represents one gene in the brown module. (D) Venn diagrams showing the number of common genes within brown module and DEGs identified from HT with LVH and non-LVH samples.