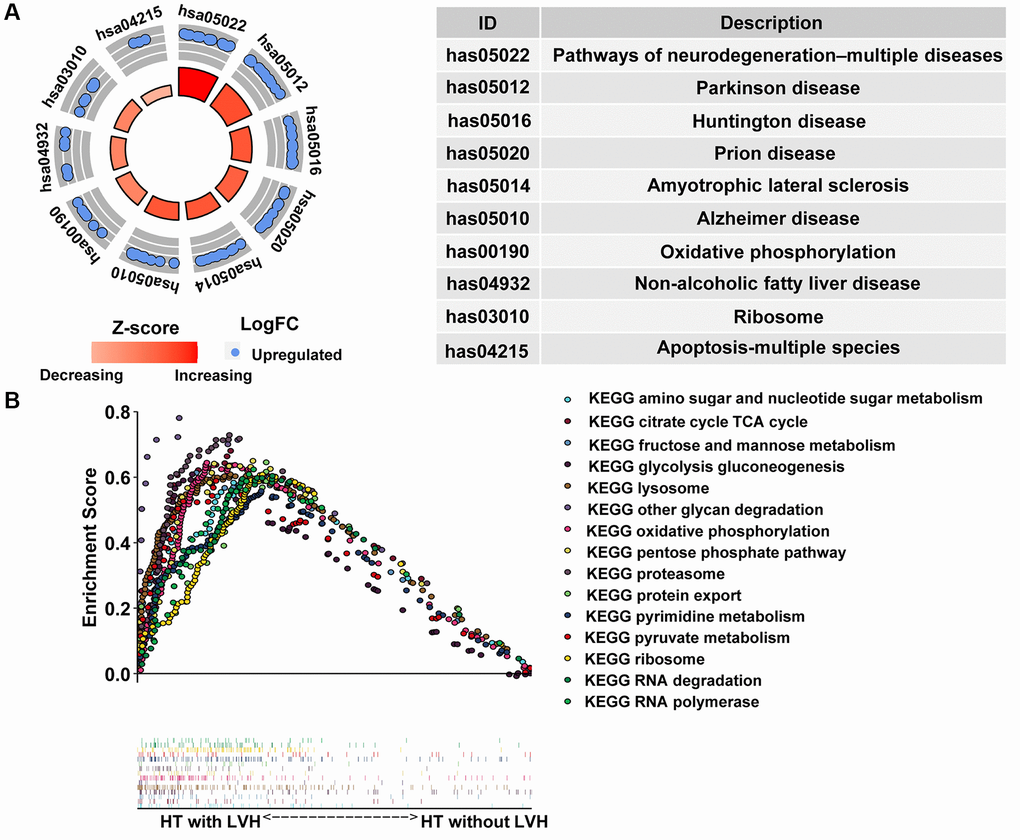
Figure 5.Pathway enrichment analysis. (A) The circle plot of KEGG enrichment analysis. Each spot in the circle represents a gene, and the outer circle refers to significant enrichment signaling pathways IDs. The inner circle shows the Z-score, the color depth corresponding to the value of the Z-score. The right table annotates the specific KEGG pathways. (B) Fifteen significantly enriched pathways in the HT with LVH group through gene set enrichment analysis (GSEA).