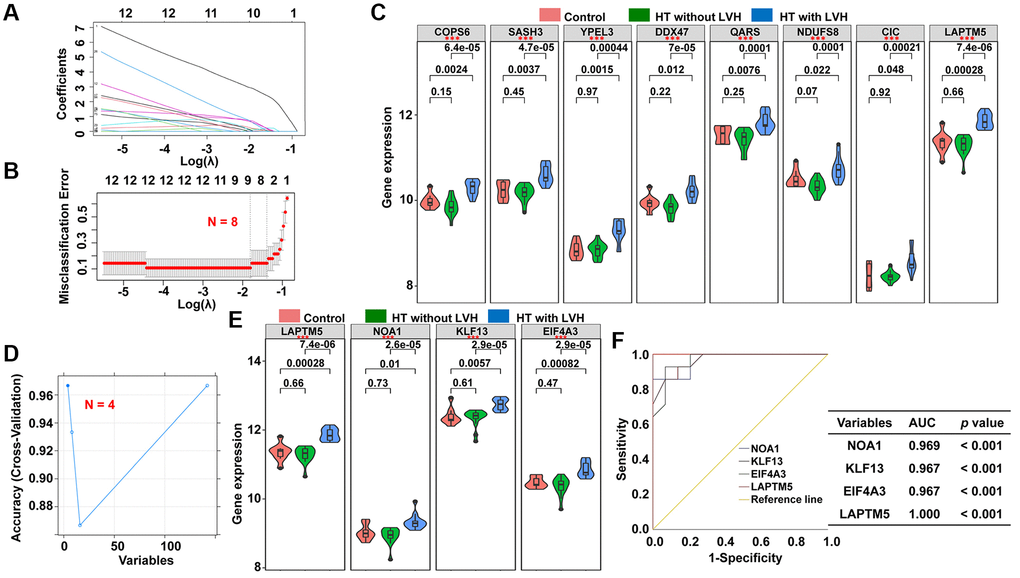
Figure 6.Screening of potential diagnostic markers for HT with LVH by LASSO and SVM-REF algorithm. (A) LASSO coefficient profiles of the 142 genes. Different color curves signify different genes. The numbers on the top of the figure indicate the number of the candidate genes entering in LASSO regression according to various lambda (λ) values displayed in the bottom of the figure. (B) Five-fold cross-validation to select the optimal tuning parameter (λ). The right dashed lines show the optimal values by 1-SE criteria (λ = 0.2729728). (C) The difference in expression level of the subset genes among the three groups (*p < 0.05; **p < 0.01; ***p < 0.001). (D) The blue solid points indicate the maximum classification precision through ten-fold cross-validation, and the corresponding genes sets at this point are the best diagnostic markers selected by SVM. (E) Violin plots showing the expression patterns of the four genes screened by SVM-RFE algorithm among the three groups (*p < 0.05; **p < 0.01; ***p < 0.001). (F) ROC curve analyses of the four genes filtered by SVM-REF algorithm showing the diagnostic efficacy for HT with LVH subjects.