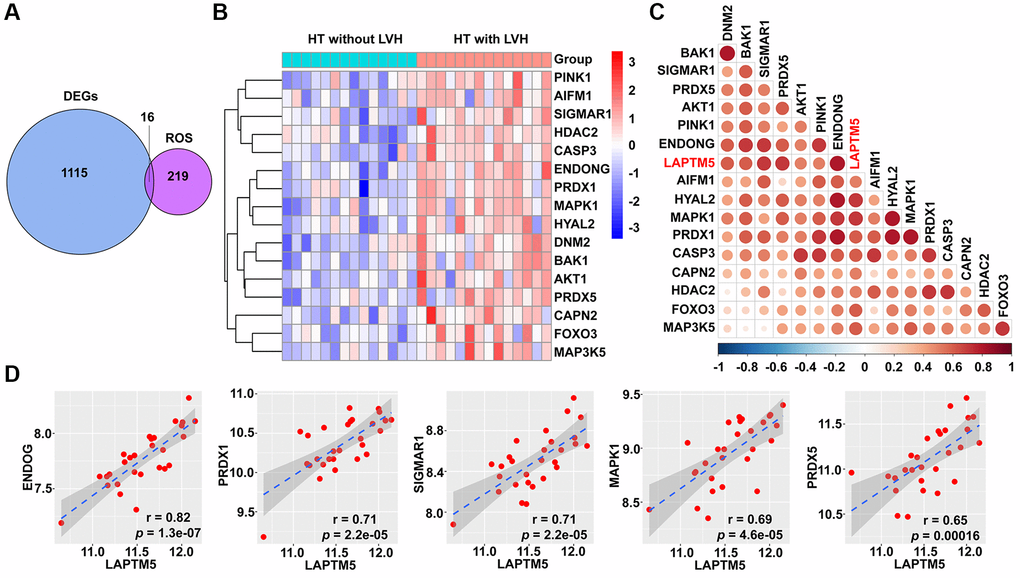
Figure 7.Correlation between LAPTM5 expression and ROS-related genes in HT with LVH and non-LVH groups. (A) Venn diagram depicts the 16 overlapped DEGs and ROS-related genes. (B) Heat map demonstrates the expression profile of differentially expressed ROS-related genes in HT with LVH and without LVH. Genes upregulated (red), downregulated (blue), and unchanged (white) are delineated. (C) Heat map of Spearman’s correlation coefficients between LAPTM5 and significantly altered ROS-related genes. The color depth of circle represents the strength of the correlation, red represents a positive correlation, and blue indicates a negative correlation. Darker color indicates stronger correlation. (D) Scatterplots show the top five ROS-related genes that have significant positive correlations with LAPTM5. The x-axis shows LAPTM5 expression, and the y-axis shows the expression of ROS-related genes. The Spearman correlation coefficients (r) and corresponding p values are shown at the bottom right corner of each plot.