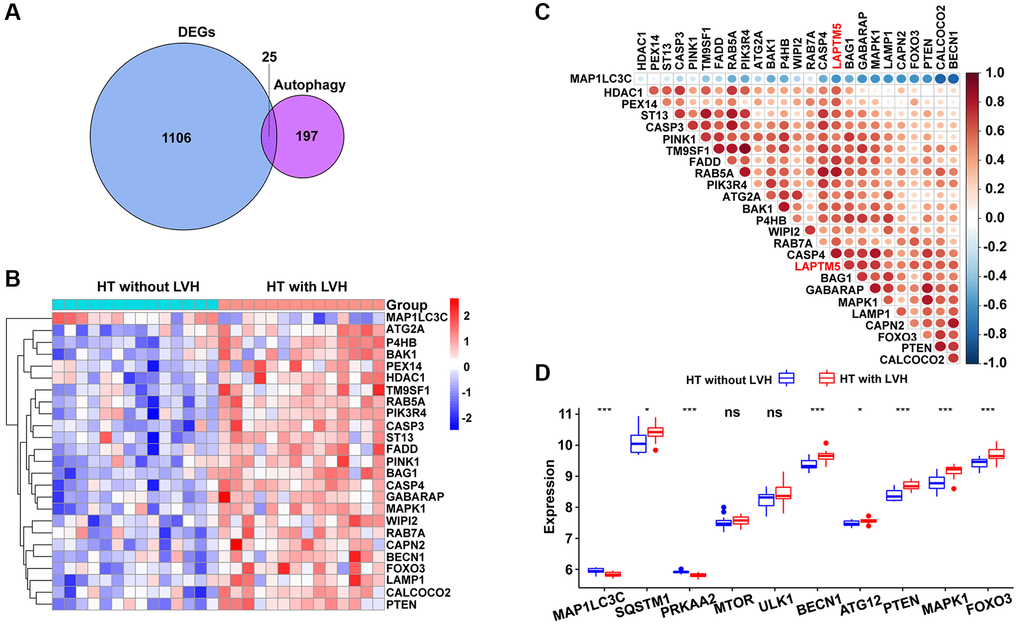
Figure 8.Association between LAPTM5 expression and autophagy-related genes in HT with LVH and non-LVH groups. (A) Venn diagram showing 25 shared genes by DEGs and autophagy-related genes. (B) Heat map illustrates the expression pattern of differentially expressed autophagy-related genes in HT with LVH and without LVH. Red exhibits upregulated genes, while blue stands for downregulated genes in the hypertensive LVH group. (C) Spearman’s correlation coefficients heat map showing gene co-expression patterns between LAPTM5 and significantly altered autophagy-related genes. The color depth of circle represents the strength of the correlation, red represents a positive correlation, and blue indicates a negative correlation. Darker color indicates a stronger correlation. (D) Box showing the expression levels of 10 autophagy-related genes between HT with LVH and non-LVH groups.