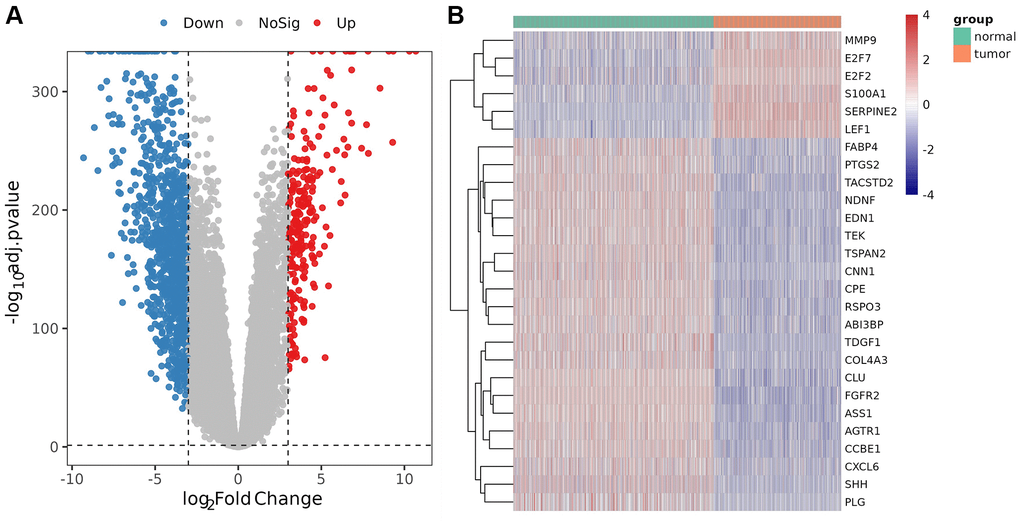
Figure 1.Analysis of differentially expressed genes (DEGs) and DE-AFs. (A) Volcano plot of DEGs between tumor and normal samples. (B) Heatmap of DE-AF expression between tumor and normal samples. Tumor samples and normal samples are shown in green and orange, respectively. Red indicates genes that had higher expression levels, and blue indicates genes with lower expression levels.