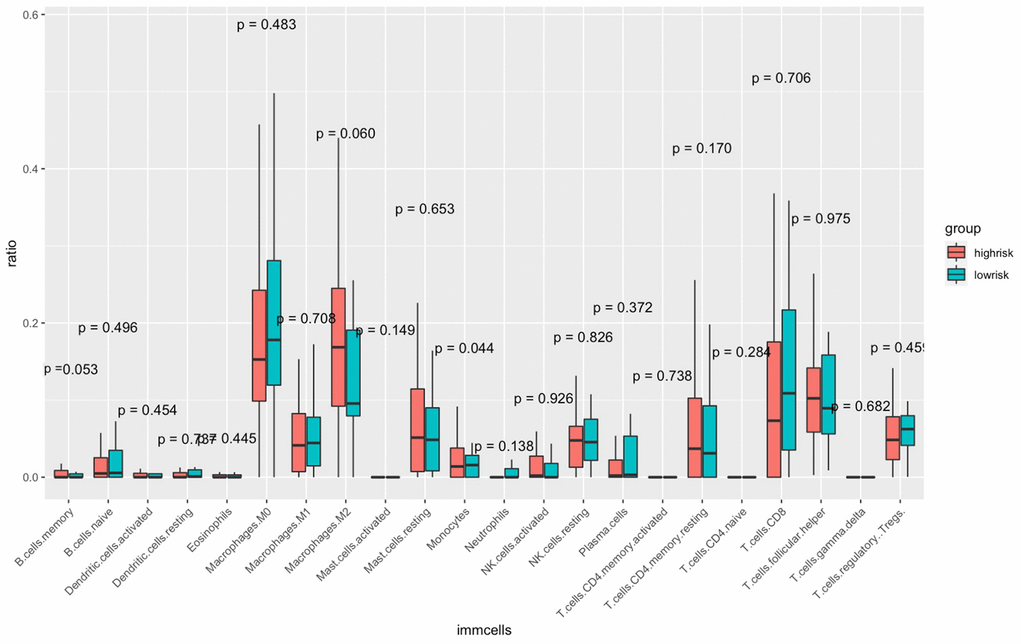
Figure 10.Comparisons of the abundance of infiltrating immune cells between the high- and low-risk groups. The horizontal axis is the immune cells, and the vertical axis is the infiltration fraction. High-risk and low-risk patients are marked in red and blue, respectively.