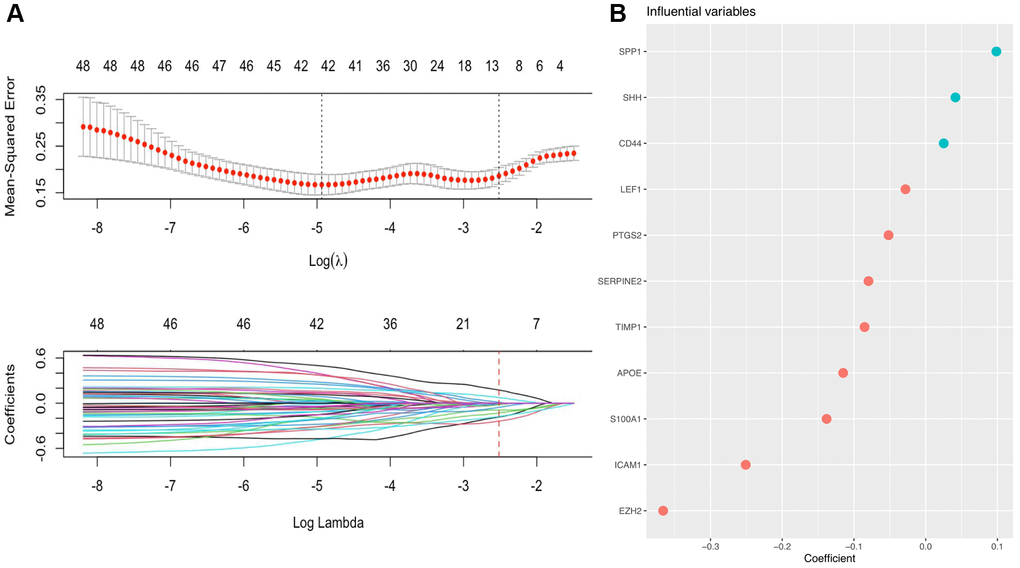
Figure 3.A prognostic gene signature based on AFs was established by LASSO regression analysis. (A) Determination of the number of factors by LASSO analysis. The mean square error distribution and the coefficient distribution of all variables under different lambda are from top to bottom. (B) The distribution of significant coefficient variables.