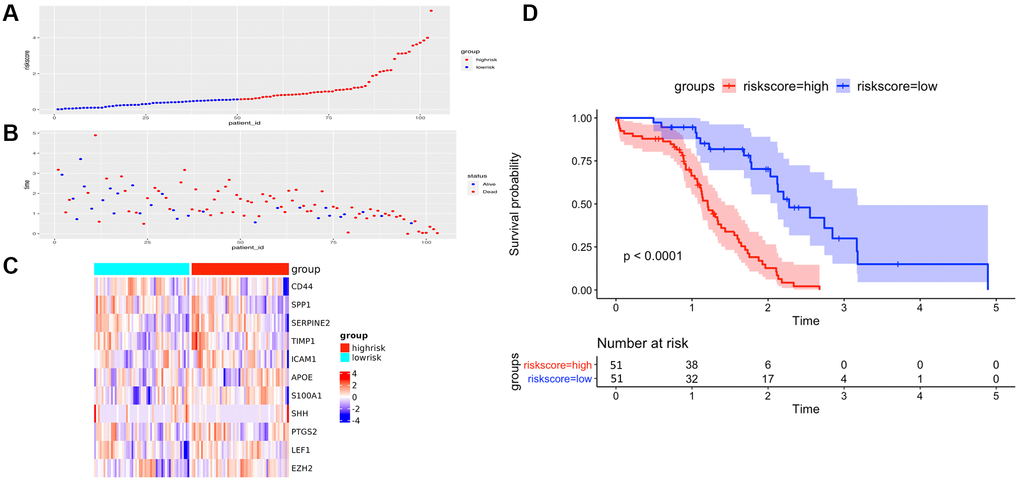
Figure 5.The performance of overall survival (OS) in the TCGA cohort based on the 11-AF signature. (A) The distribution of high-risk and low-risk patients based on the risk score ranking. (B) The survival duration and status of the patients. The horizontal axis is the sample, and the vertical axis is the survival time. (C) Heatmap of significant survival-related DE-AFs between high- and low-risk patients. (D) Kaplan–Meier survival curves of overall survival of the high- and low-risk groups stratified by the risk score calculated by the 11-AF signature risk prediction formula.