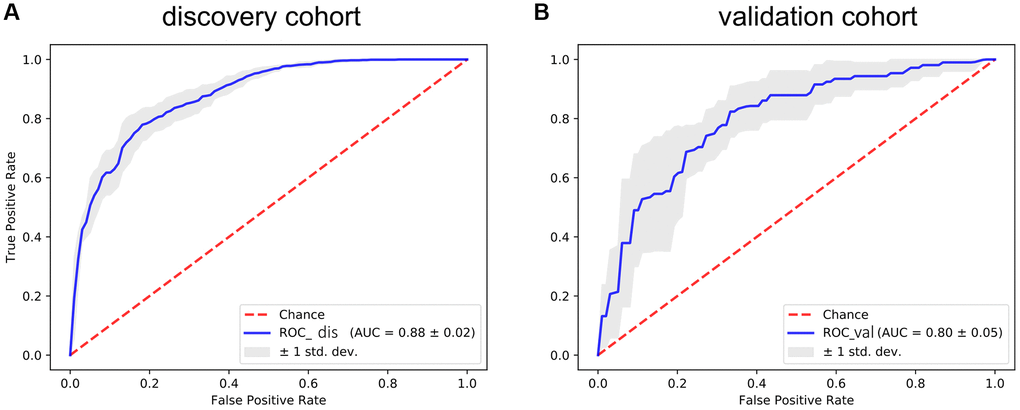
Figure 7.The ROC curve for assessing the predictive power of the AF signature in the discovery cohort and validation cohort. (A) The ROC curve of the discovery cohort. (B) The ROC curve of the validation cohort. The red dotted line is the random line, the blue curve is the AUC curve, and the gray line is the confidence interval.