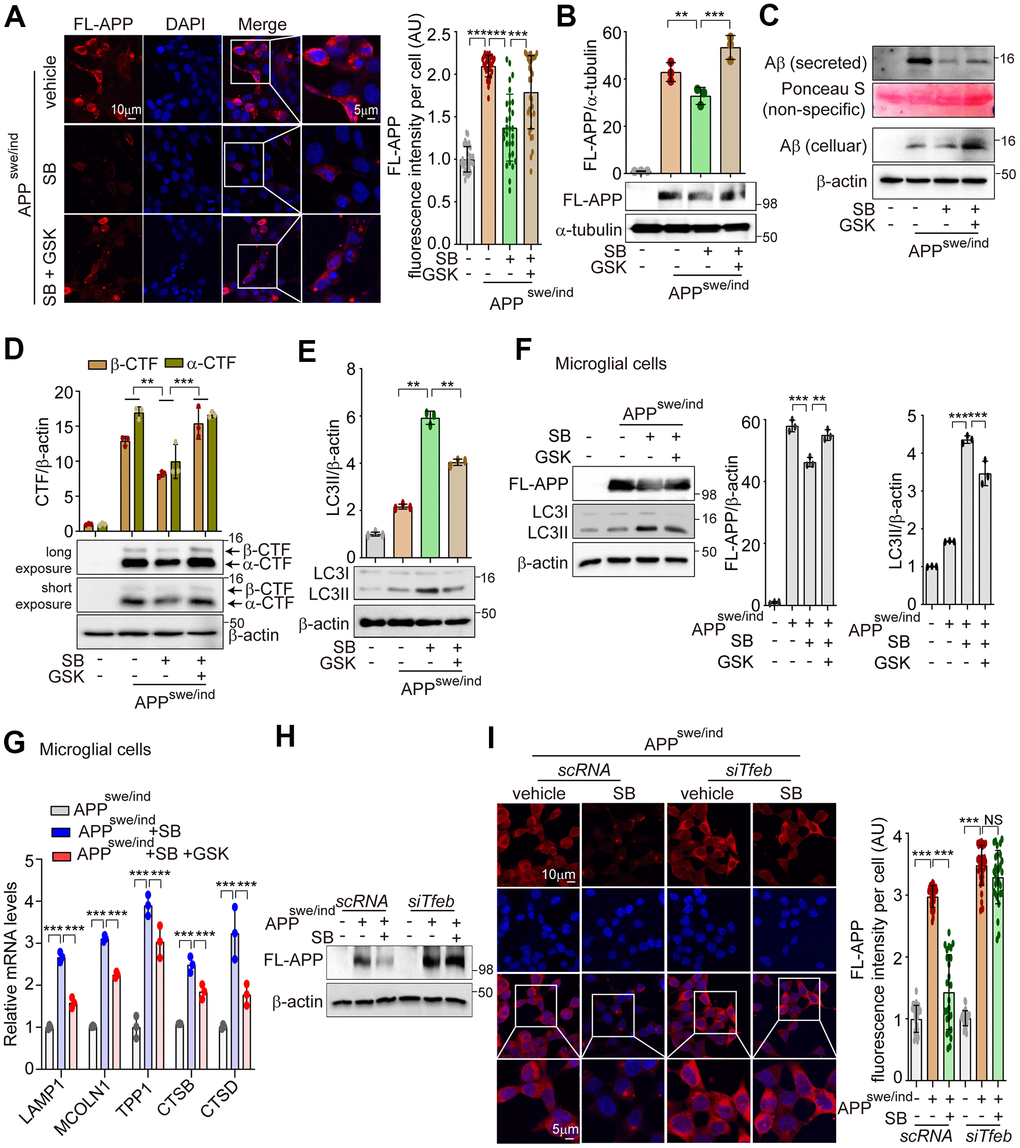
Figure 6.PERK activation by SB202190 reduces the aggregation of APP accumulation through TFEB-ALP activation in SH-SY5Y cells. (A, B) SH-SY5Y cells were transfected with pCAX-APP-Swe/Ind (APPswe/ind) for 48 h. Under this condition, cells were treated with the PERK inhibitor, GSK2606414 (1 μM, 1 h), before SB202190 (20 μM, 12 h) treatment. (A) Cells were stained with DAPI and immunostained with anti-FL-APP antibody. Representative image of FL-APP was observed by confocal microscopy (left) and quantification of FL-APP intensity (right). Data represent mean ± SD; ***p<0.001. (B) Western blotting was performed to detect the expression levels of FL-APP. Quantification of FL-APP expression was shown in the upper panel. (C) The levels of intracellular Aβ and secreted Aβ were detected by western blotting. (D, E) The cells were subjected to western blotting by antibodies against α/β-CTF (D) and LC3B (E). Quantification of α/β-CTF and LC3B-II conversion was analyzed upper. Data are mean ± SD (n=3), **p<0.01; ***p<0.001. (F, G) HMC3 cells were transfected with pCAX-APP-Swe/Ind (APPswe/ind) for 48 h and then treated with SB202190 (20 μM, 12 h) in the presence or absence of PERK inhibitor, GSK2606414 (1 μM, 1 h). (F) Cells were detected to antibodies against APP and LC3B by western blotting. Quantification of FL-APP and LC3B-II conversion was analyzed. Data are mean ± SD (n=3), **p<0.01; ***p<0.001. (G) Lysosomal genes, LAMP1, MCOLN1, TPP1, CTSB, and CTSD were measured by qRT-PCR. Data are represented as mean ± SD, ***p<0.001. (H, I) SH-SY5Y cells were co-transfected with pCAX-APP-Swe/Ind (APPswe/ind) and siTfeb for 48 h and were treated with SB202190 (20 μM, 12 h). (H) Cells were detected to antibody against FL-APP by western blotting. (I) Cells were stained with antibody against FL-APP and DAPI. Representative image of FL-APP was obtained by confocal microscopy (left) and quantification of FL-APP intensity (right). Data represent as mean ± SD; ***p<0.001 and not significant (NS).