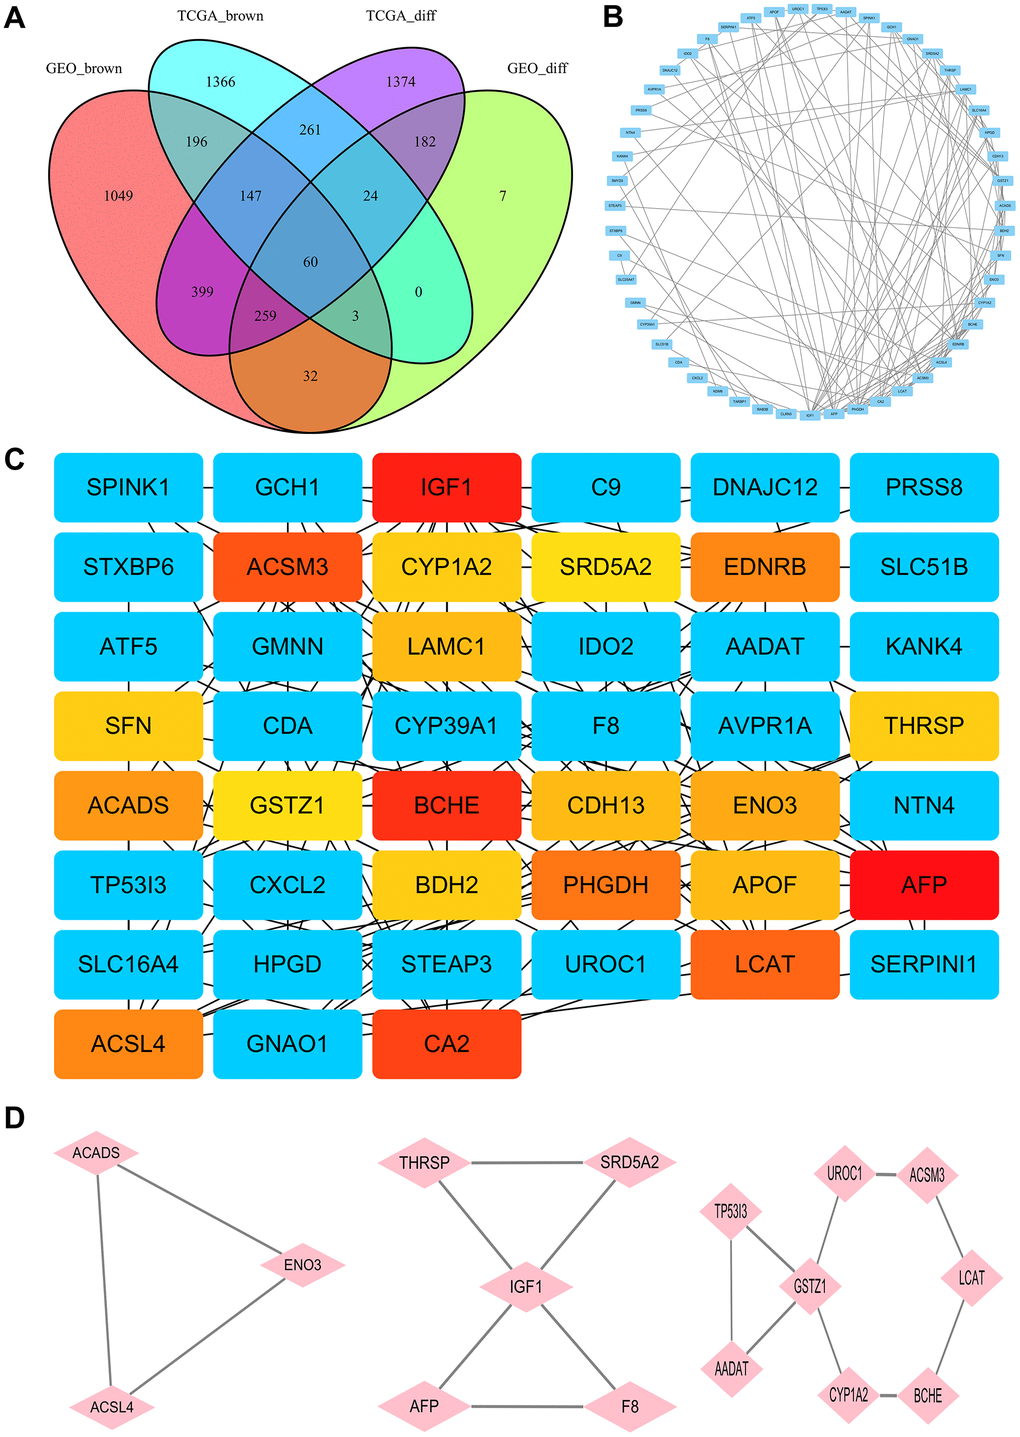
Figure 2.Identification of hub genes. (A) The Venn diagram for selection of the differential co-expression genes among DEG lists and co-expression modules. (B) PPI network of the intersection genes between DEG lists and co-expression modules. Each blue node represents a gene. Edges among nodes indicate interaction associations between genes. (C) Identification of the core genes from the PPI network by MCC algorithm. Darker colors refer to higher MCC sores. (D) The top three significant modules of the PPI network were evaluated in MOCDE. Pink nodes represent genes in corresponding modules.