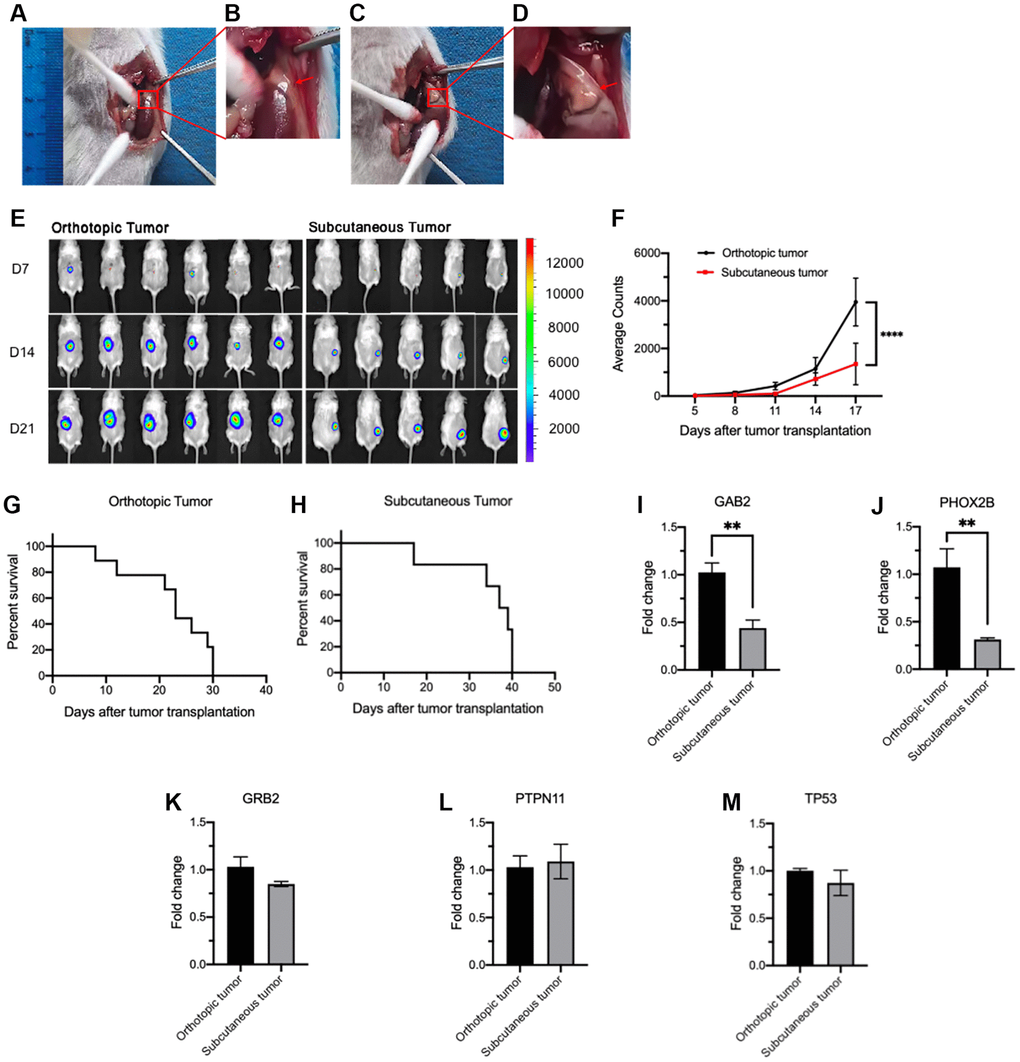
Figure 1.Comparison of tumorigenesis and gene expression between orthotopic and subcutaneous CDX models. (A–D) Illustration of orthotopic implantation. (A) Exposure of adrenal gland. (B) Local magnification of Figure 1A. (C) The expanded adrenal gland which is filled with tumor cells (20 μL). (D) Local magnification of Figure 1C. (E, F) Tumor growth measured by bioluminescence signals using in vivo imaging system. Representative bioluminescence images at the indicated time points (E) and tumor growth curves (F) (orthotopic, n = 6; subcutaneous, n = 5). (G, H) Survival curves of orthotopic (G, n = 8) and subcutaneous CDX mice (H, n = 8). (I–M) Relative expression of GAB2 (I), PHOX2B (J), GRB2 (K), PTPN11 (L) and TP53 (M) in orthotopic (n = 3) and subcutaneous tumor cells (n = 3). Data were normalized to the levels of orthotopic CDX mouse group. Data are presented as the mean ± SEM. **P < 0.01. ****P < 0.0001.
Figure 1 — Different tumorigenicity and distinct metastasis and gene signature between orthotopic and subcutaneous neuroblastoma xenografted mice | Aging