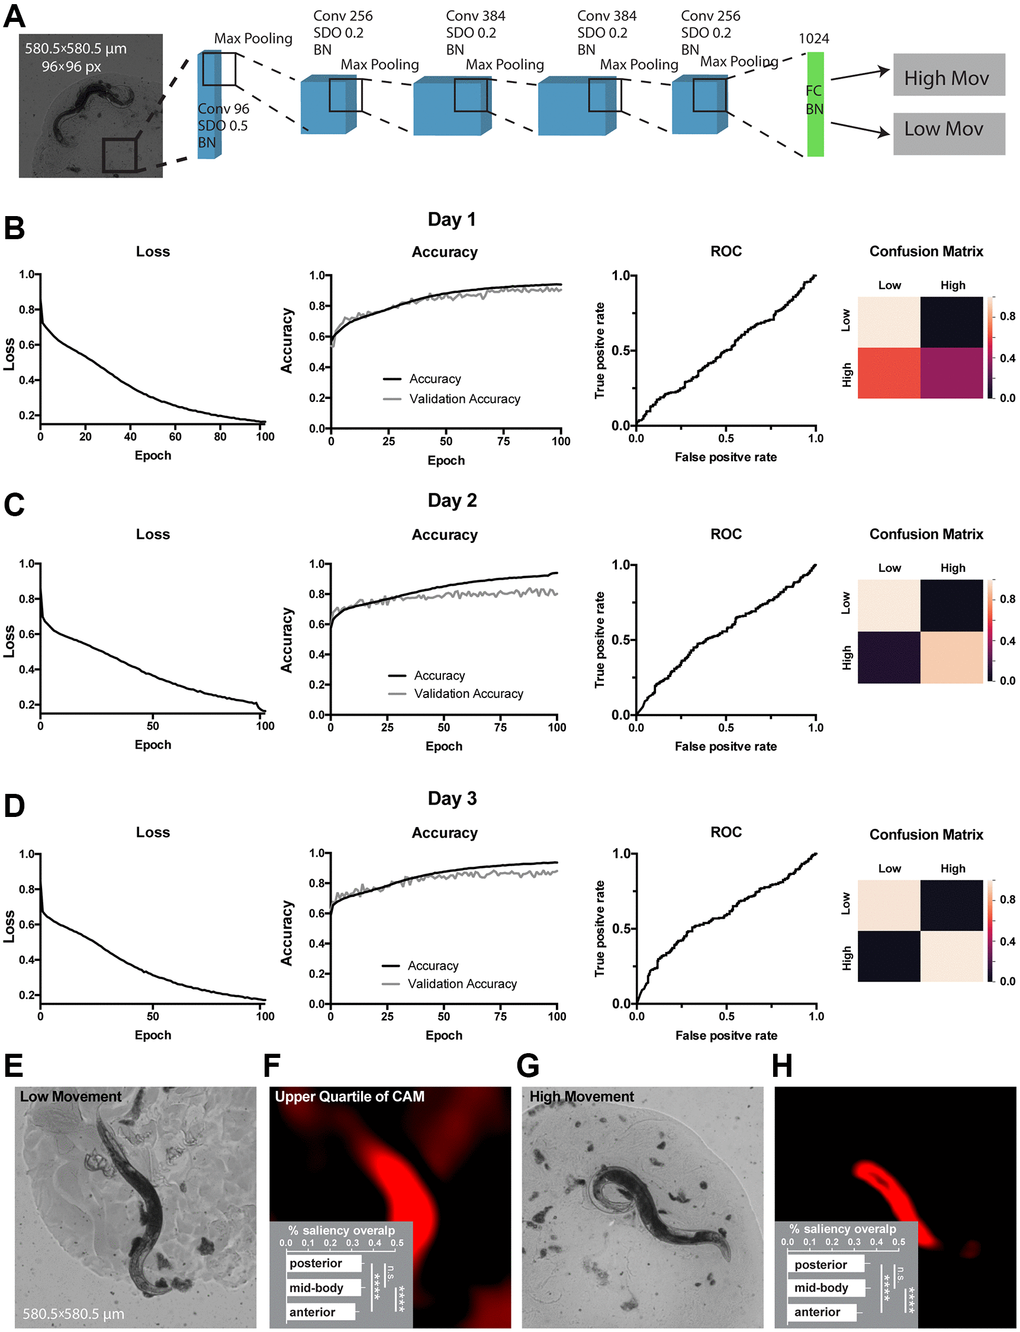
Figure 2.Classification of movement from end-point C. elegans micrographs accompanied by the by-design-interpretation based on segmentation and saliency union. (A) Schematic depiction of the WormNet architecture. Numbers correspond to the number of filters in convolutional (Conv), fully connected (FC), batch normalization (BN) and activation (Act) layers. Max pooling layers were combined with spatial dropout (SDO). (B–D) End-point day 1, 2 and 3 (respectively) micrographs classification loss (cost function), accuracy, receiver operating characteristic (ROC) curve, and confusion matrix. Training and test (validation) holdouts are depicted as black and light-grey lines respectively. (E) Low movement test micrograph example. (F) Upper quartile of saliency through class activation map (CAM) from image in E accompanied by the quantified by-design-interpretation using HydraNet 4 and CAM union (% saliency overlap). One-way ANOVA with Tukey’s HSD correction. Mean ± SEM, p-value <0.0001. (G) High movement test micrograph example. (H) Upper quartile of saliency through class activation map (CAM) from image in G accompanied by the quantified by-design-interpretation using HydraNet 4 and CAM union (% saliency overlap). One-way ANOVA with Tukey’s HSD correction. Mean ± SEM, p-value <0.0001. Here, the reference size of the field-of-view is 580.5 μm by 580.5 μm.