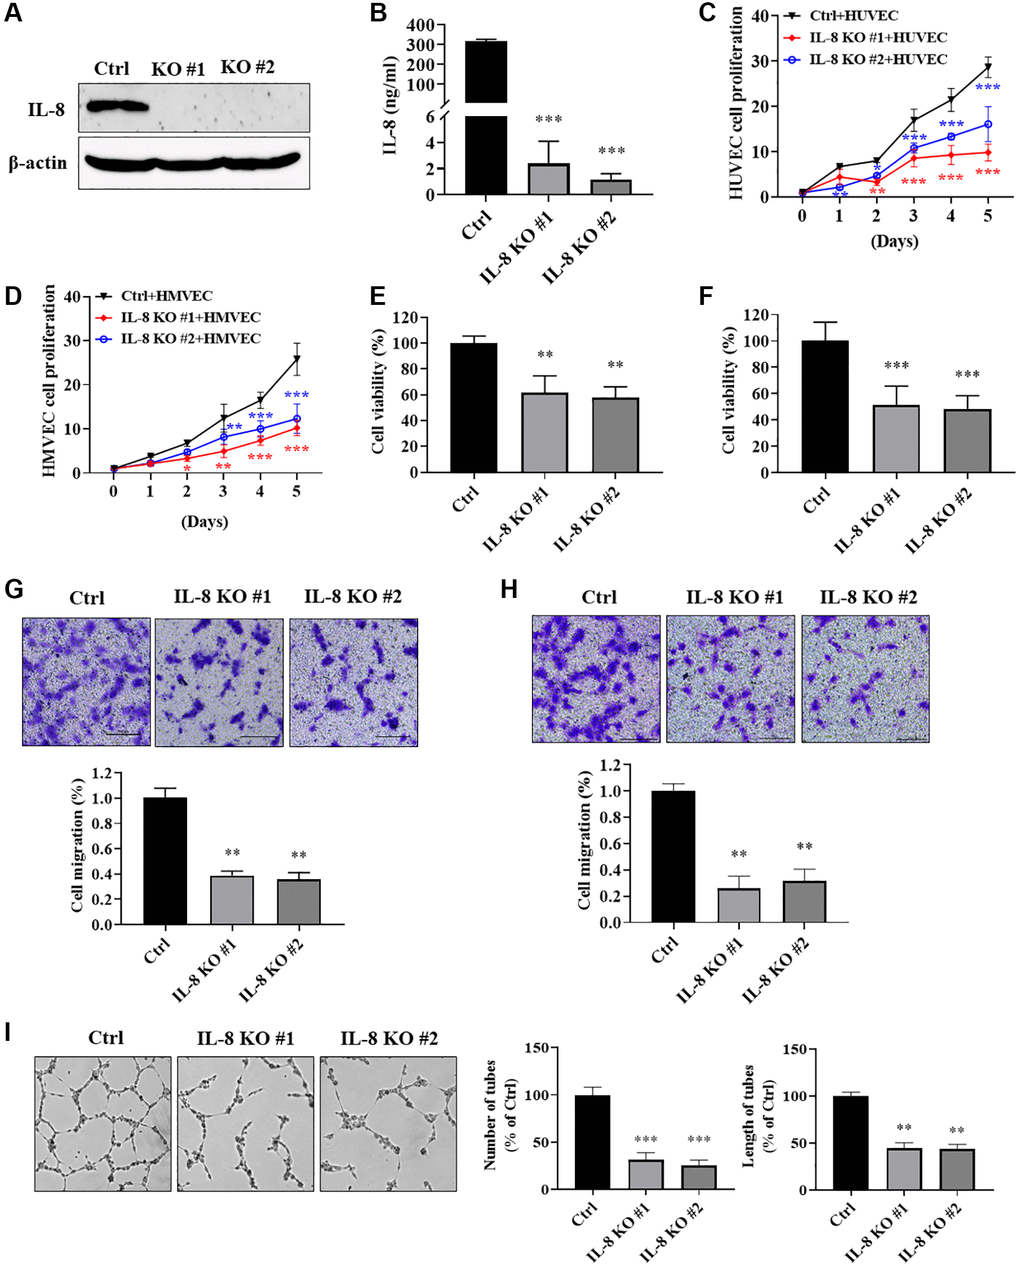
Figure 6.IL-8 knockout in As-T cells impeded vascular endothelial cell proliferation, migration, and tube formation. We generated As-T IL-8 knockout (KO) and control (Ctrl) stable cells using the CRISPR/Cas9 technique. (A) Complete depletion of IL-8 in As-T cells was confirmed using immunoblotting assay. (B) The protein levels of IL-8 in the CM from As-T Ctrl and two IL-8 KO stable cell lines were measured using ELISA assay. (C and D) GFP-positive HUVECs (C) or HMVECs (D) and As-T Ctrl or IL-8 KO cells were mixed in a 1:1 ratio and seeded into 6-well plates. The number of GFP-positive cells was counted on indicated days. ** and ***p < 0.01 and p < 0.001, respectively, compared to the As-T Ctrl group. (E and F) HUVECs (E) or HMVECs (F) were incubated with the CM from As-T Ctrl and IL-8 KO cells for 4 days. The cell viability was determined by counting the number of trypan blue negative cells. ** and ***p < 0.01 and p < 0.001, respectively, compared to the CM from As-T Ctrl group. (G and H) Transwell migration assays were performed to evaluate the effects of IL-8 KO on HUVECs (G) or HMVECs (H) migratory ability. HUVECs or HMVECs were plated on the top chamber in 200 μL basic EBM2 medium; the lower chamber was filled with 600 μL CM from As-T Ctrl or IL-8 KO cells. The cells that passed through the membrane were stained with crystal violet and counted under the microscope after 24 h. The images were taken at 10× magnification. Upper panel: representative images; bottom panel: quantification of migrated cells. **p < 0.01 compared to the wild type As-T Ctrl group. (I) A tube formation assay was performed using the CM from control and IL-8-null cells as described above. The images of the tubular structures were taken using an inverted microscope at 4× magnification. Left panel: representative images of the tubular structures. Middle panel: quantification of the number of the tubular structures. Right panel: quantification of the length of the tubular structures. ** and ***p < 0.01 and p < 0.001, respectively, compared to CM from wild type As-T Ctrl cells.