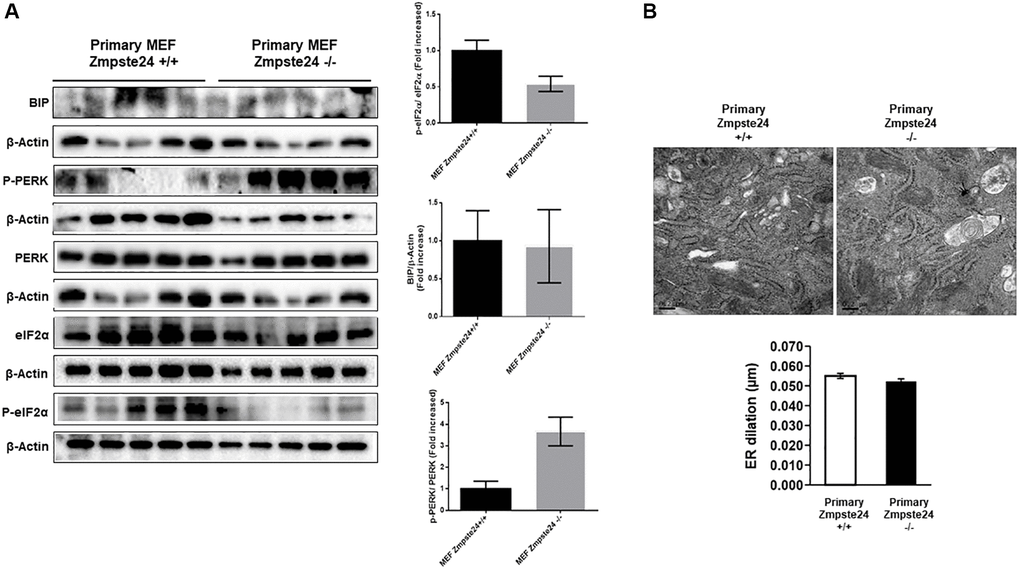
Figure 5.ER stress is not increased in primary Zmpste24 KO cells. (A) Immunoblot analysis of BIP, P-PERK, PERK, eiF2α and P- eiF2α using β actin as loading control, in the cell extracts in basal state (n = 5). The plot indicates the quantification data of eiF2α/β-actin ratio, P-eiF2α 62/eiF2α ratio, BIP/Tubulin ratio and P-PERK/PERK ratio in the basal state. Data represent the mean ± standard error of the mean (SEM). Differences were determined by unpaired Student t-test analysis. (B) Electron microscopy of ER of Primary MEF Zmpste24 WT and KO cells in basal state. The plot indicates the quantification data of ER dilation using Image J.