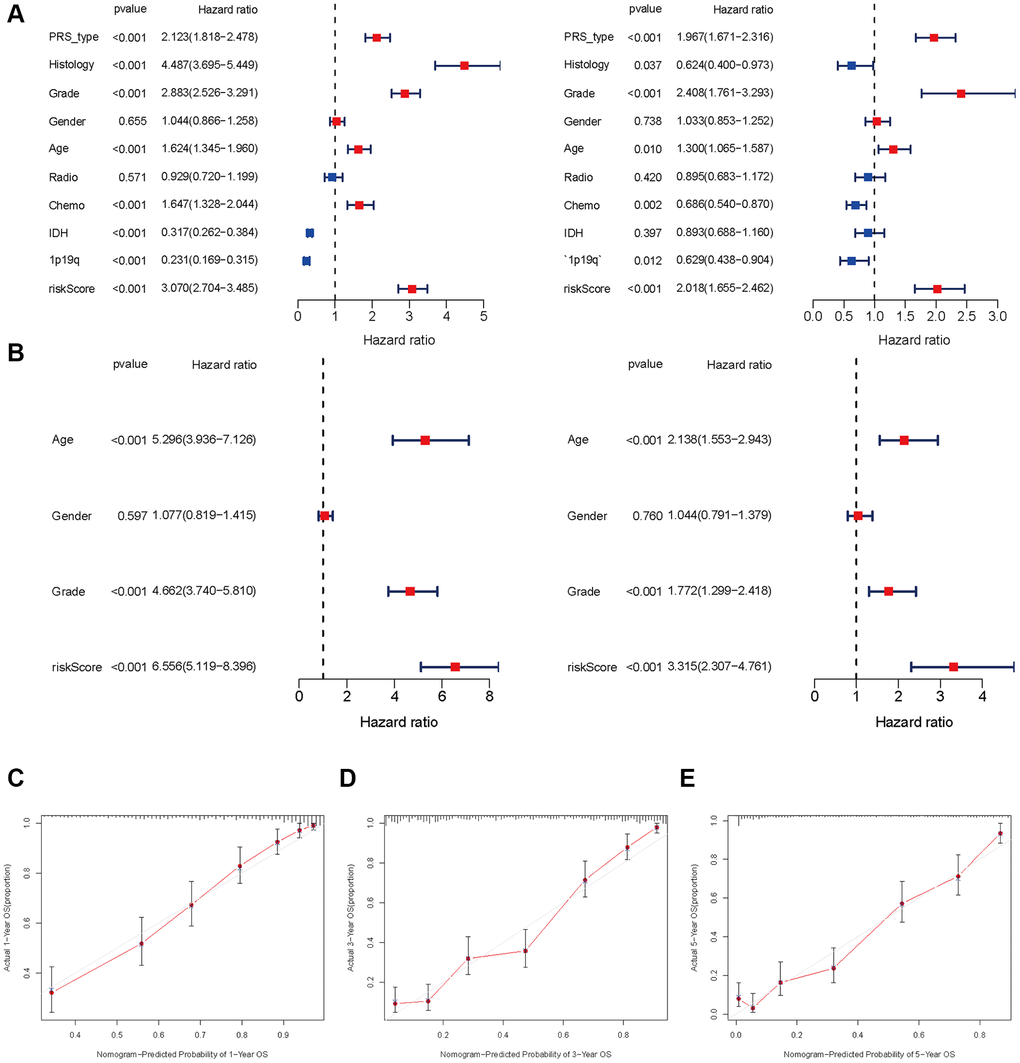
Figure 5.Independent prognosis analysis of risk score. (A and B) Univariate and multivariate cox forest plot of risk score in CGGA and TCGA. (C–E) Calibration plots of the nomogram for predicting the probability of OS at 1, 3, and 5 years in the CGGA.