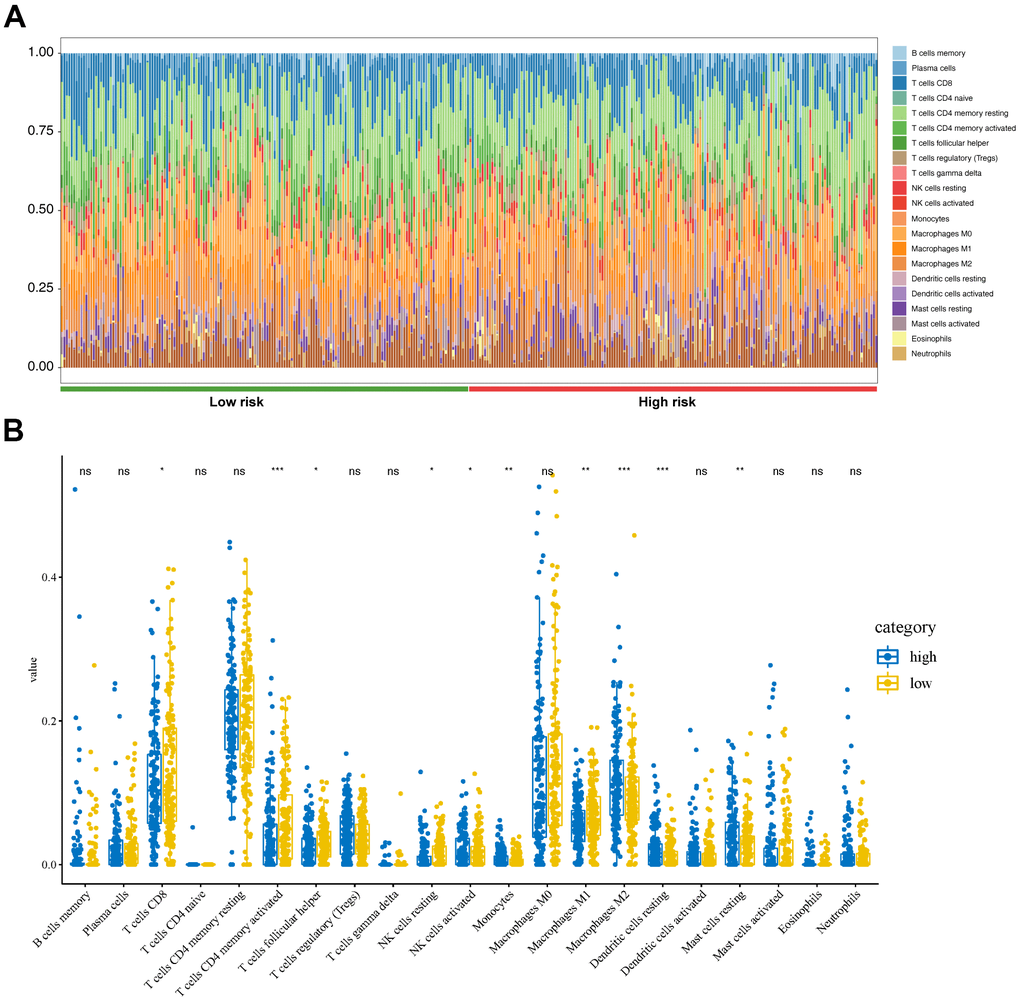
Figure 7.Tumor immunity analysis based on the CDG signature. (A) Relative proportion of immune cells between high- and low-risk groups. (B) Violin plot depicting differences in the abundances of 22 types of immune cells between the high- and low-risk groups.