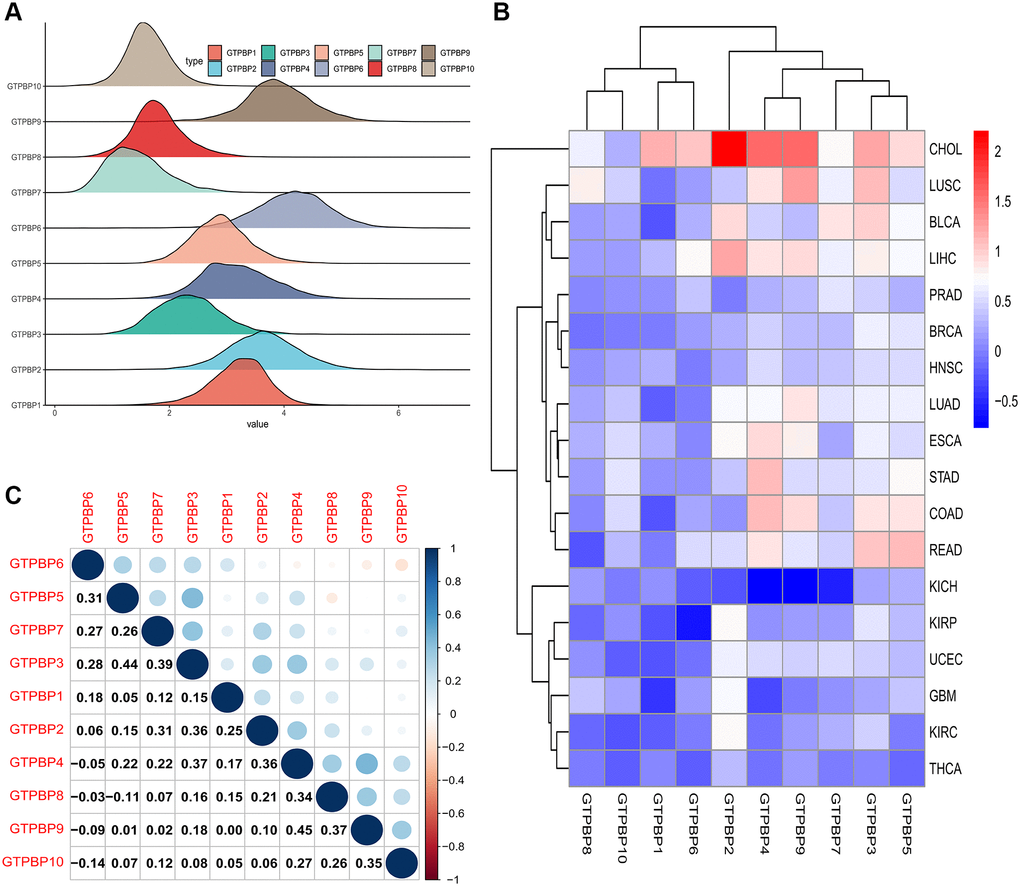
Figure 2.Expression of GTPBP family across cancers and the relationship between the GTPBP members. (A) The Ridgeline Plot showed the fluctuation of GTPBPs expression in the data: The steeper the mountain, the more concentrated the data distribution is, and there are few discrete values between the data. The flatter the mountain, the more fragmented the data. (B) The heat map of the expression of the GTPBP family in each cancer compared to normal tissue: red represents upregulated expression, blue represents downregulated expression, and the shade of the color represents the degree of difference. (C) The graph of the correlation values among the GTPBP members.