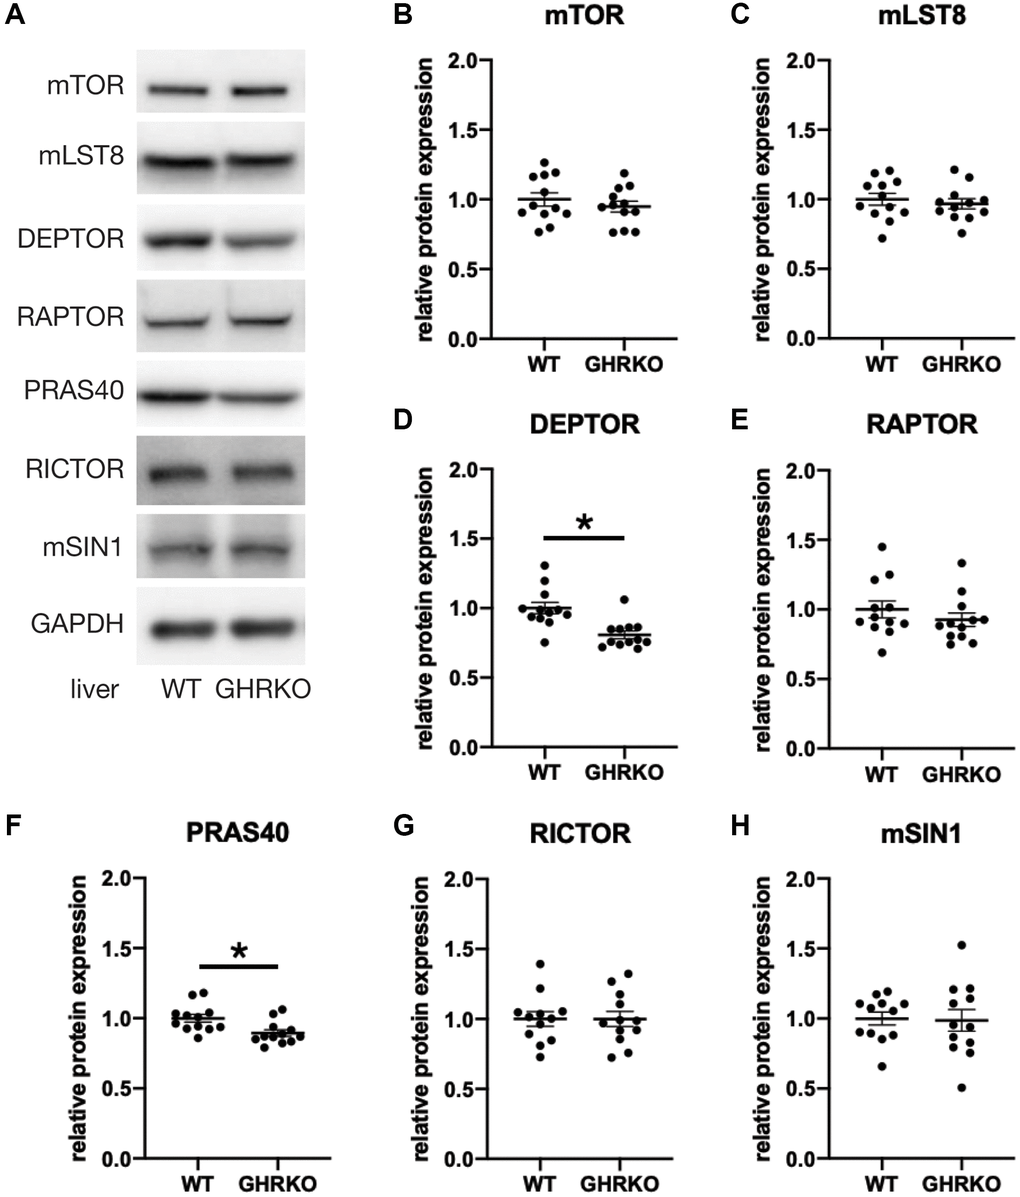
Figure 2.Reduced DEPTOR and PRAS40 protein expression in GHRKO liver. (A) Representative immunoblots of protein expression for mTORC1 and mTORC2 components. (B–H) Quantification of protein expression, for N = 6 male and N = 6 female mice, with mean and SEM. *t-test p-value < 0.05.