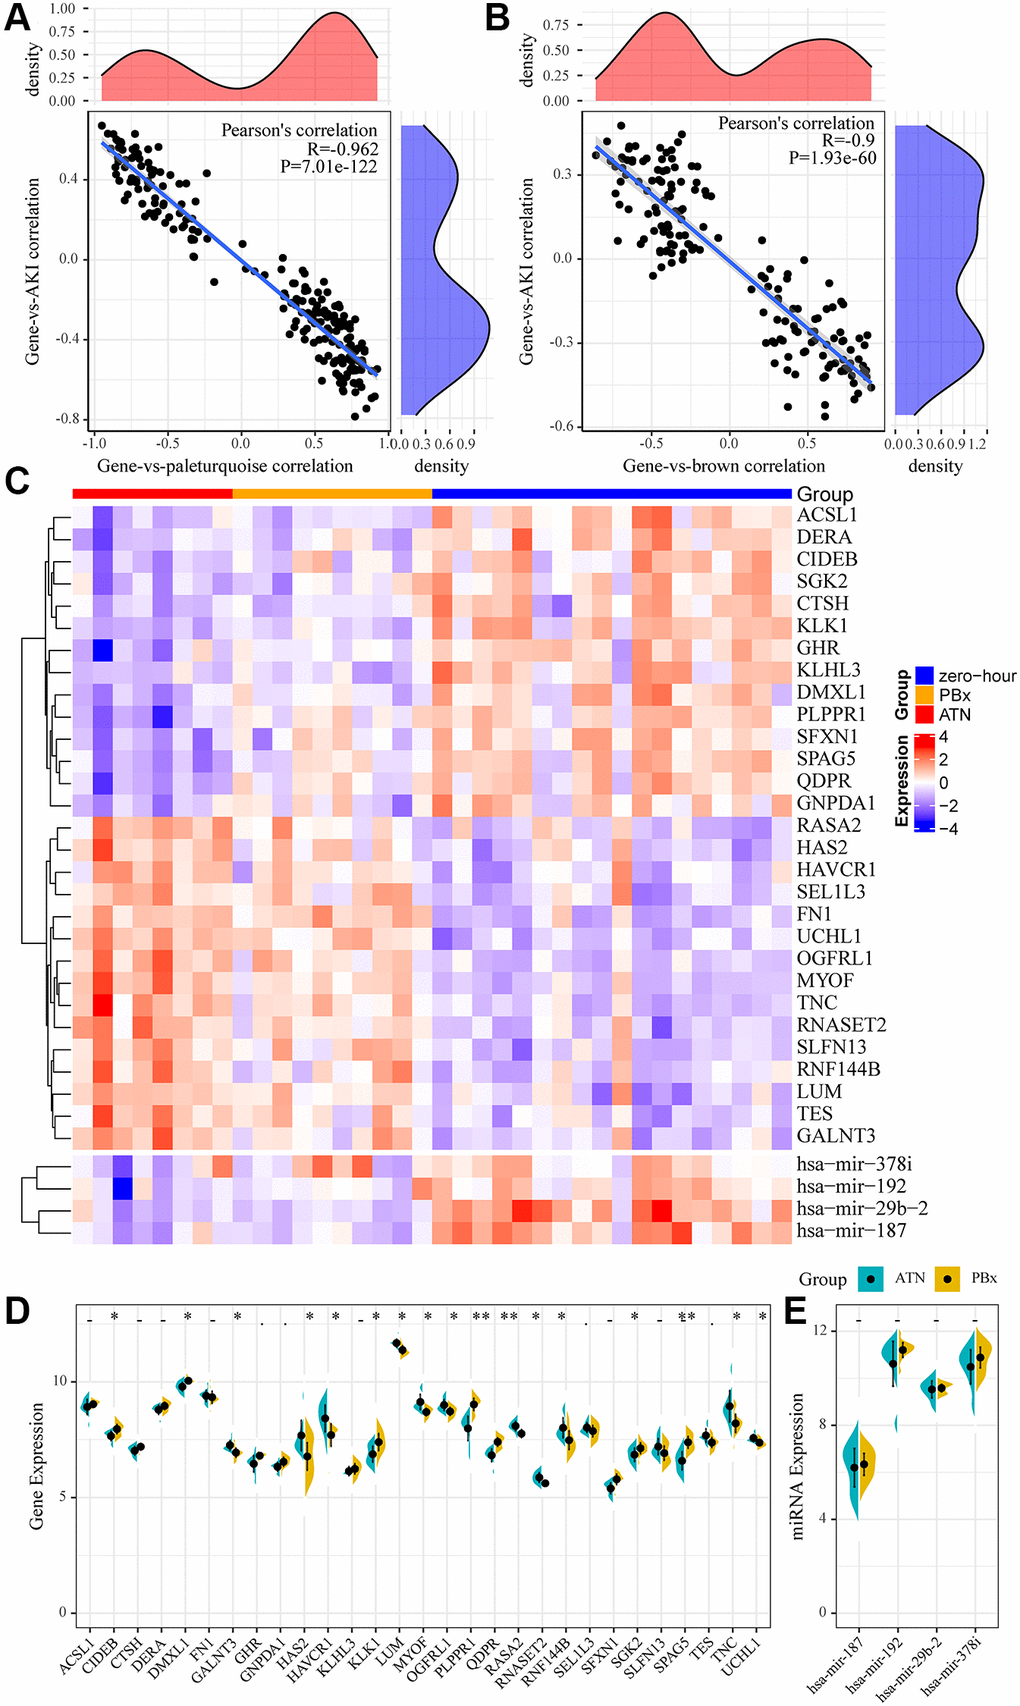
Figure 3.miRNA and mRNA specifically expressed in AKI. (A) Relationship between gene expression in pale turquoise module and module/AKI. The horizontal axis represents the correlation coefficient between gene expression and pale turquoise module, and the vertical axis represents the correlation coefficient between gene expression and AKI. (B) Relationship between miRNA expression in brown module and module/AKI. The horizontal axis represents the correlation coefficient between miRNA expression and brown module, and the vertical axis represents the correlation coefficient between miRNA expression and AKI. (C) heatmap of genes and miRNAs specifically expressed in the module. (D, E): Differences between genes and miRNAs specifically expressed in the module in AKI samples and PBx samples. Statistical p-values were obtained using the t-test, with “*” indicating p < 0.05 and “**” indicating p < 0.01, “.” indicates p < 0.1, “-” indicates p > 0.1.