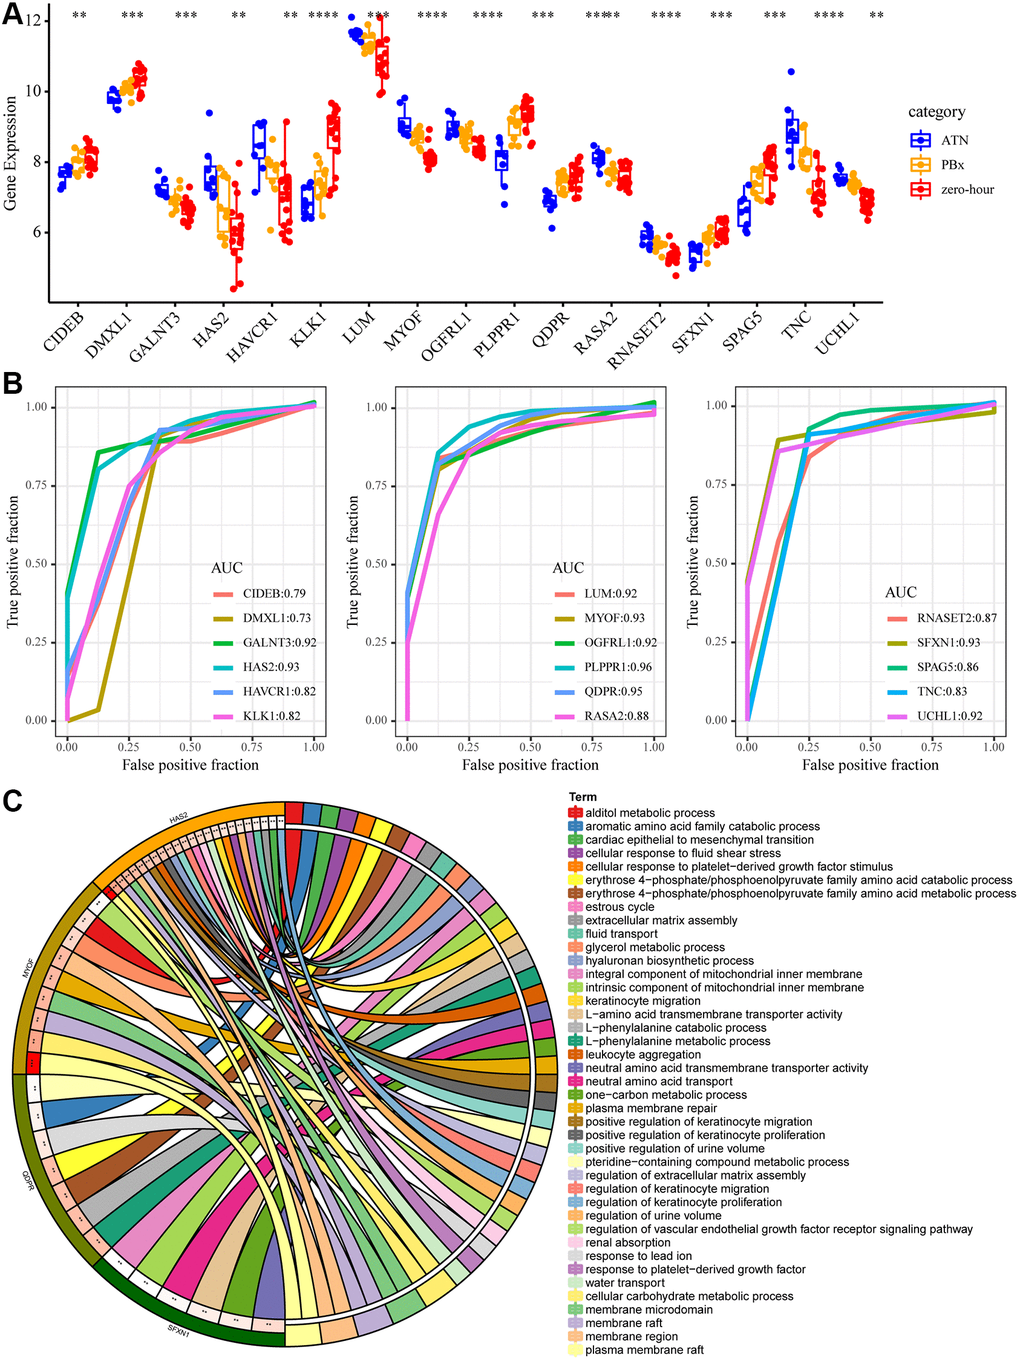
Figure 4.Key mRNA biomarkers in AKI. (A) The expression differences of the 17 genes in AKI, PBX and zero-hour, among which “*” means p < 0.05; “**” said p < 0.01; “***” means p < 0.001, “****” means p < 0.0001. (B) ROC curve of 17 genes. (C) The enrichment results of GO function of the five largest AUC genes. Different colors on the right side of the circle represent the GO Term, different colors on the left side of the circle represent genes, and the lines represent gene enrichment to the corresponding GO Term.