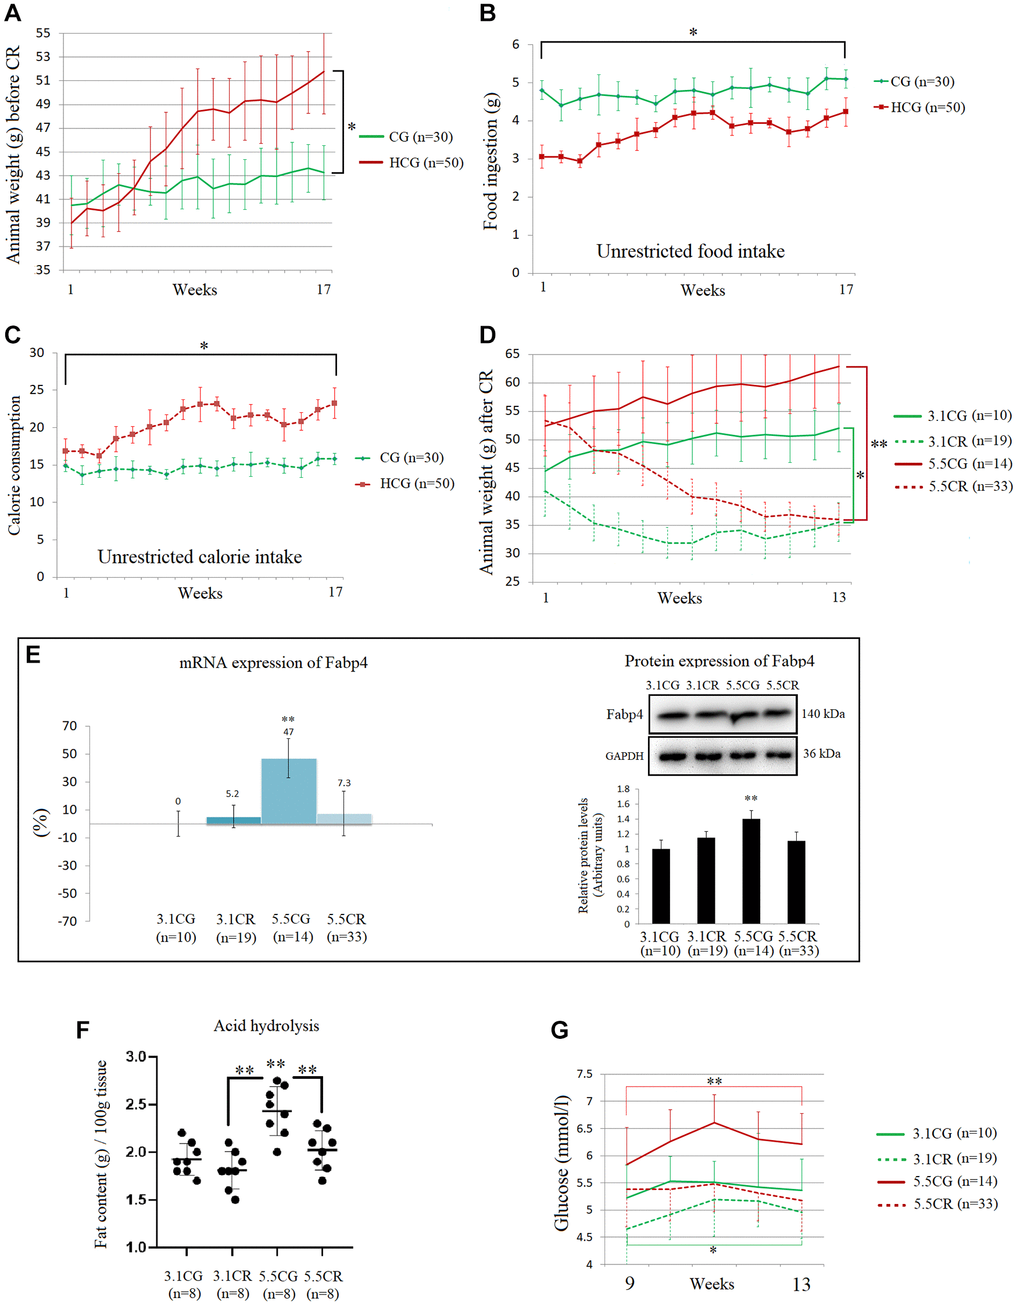
Figure 2.Physiological changes during and after the development of the experimental animal model. The graphics are representations of 1 of the 3 cohorts of animals. Average body weights of the animal groups before CR (A). Average food ingestion of the animal groups before CR, expressed in grams (B). Average caloric intake of the animal groups before CR (C). Animal weights during the CR period, expressed in grams (D). The mRNA and protein levels of Fabp4 were used to predict INTM and IM fat infiltration (E). Fabp4 analyzed by qPCR (mRNA), expressed as %; the 3.1CG value was set to 0, and the compared samples were normalized to this level. Positive % values represent upregulation. Negative values represent downregulation. The protein expression of Fabp4 was obtained by Western blot analysis and quantified with Image Lab 6.1 software. The values were normalized to GAPDH expression; the 3.1CG expression was set to 1.0. Total fat content in the WHT, as determined by acid hydrolysis (F). The values are expressed in g/100 g of tissue. Comparison of the blood glucose levels of mice during weeks 9 to 13 of dietary restriction (G). The data are the mean ± SD. *P < 0.05; **P < 0.01 vs. the 3.1CG group, unless otherwise specified.